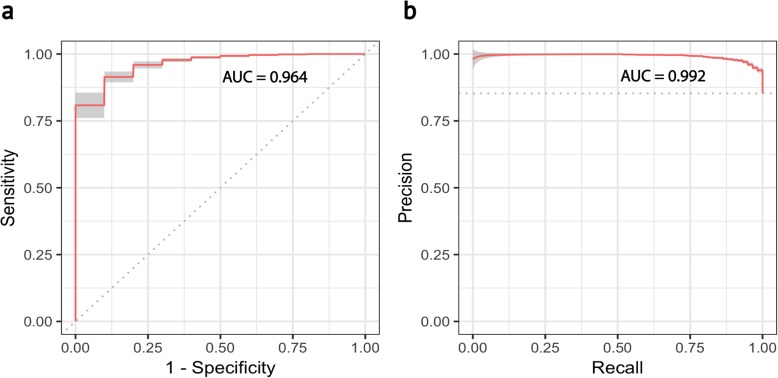
Fig. 6.
Prediction results of colorectal cancer epithelial stem/TA-like cells. The performance of the prediction was measured using the receiver operating characteristic area under the curve (ROC AUC) and the precision-recall area under the curve (PR AUC). 95% confidence bands are shown in both cases for 50 bootstrap replicates. a ROC AUC. The area under the curve shows the relationship between the cells incorrectly assigned to that come from tumor samples versus the ones that were correctly assigned by the prediction model as tumor cells using a series of different threshold points. b PR AUC. The area under the curve measures the relationship between the cells correctly classified as tumor cells versus the fraction of cells correctly assigned as tumor cells from the total number of cells classified as tumor cells. An AUC value of 0.992 shows robustness to class imbalance

