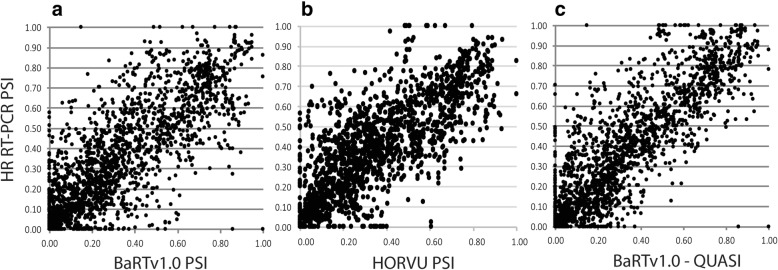
Fig. 3.
Correlation of alternative splicing from HR RT-PCR and RNA-seq. Percentage spliced in (PSI) values were calculated from relative fluorescence units from HR RT-PCR and transcript abundances (TPM) from RNA-seq data quantified with Salmon using the (a) BaRTv1.0, b HORVU and (c) BaRTv1.0-QUASI transcript datasets as reference. The 86 primer pairs designed to cv. Morex genes covered 220 AS events in BaRTv1.0 (three biological replicates of 5 different barley organs/tissues) giving 1992 data points and 81 primer pairs covered 191 AS events giving 1642 points for HORVU

