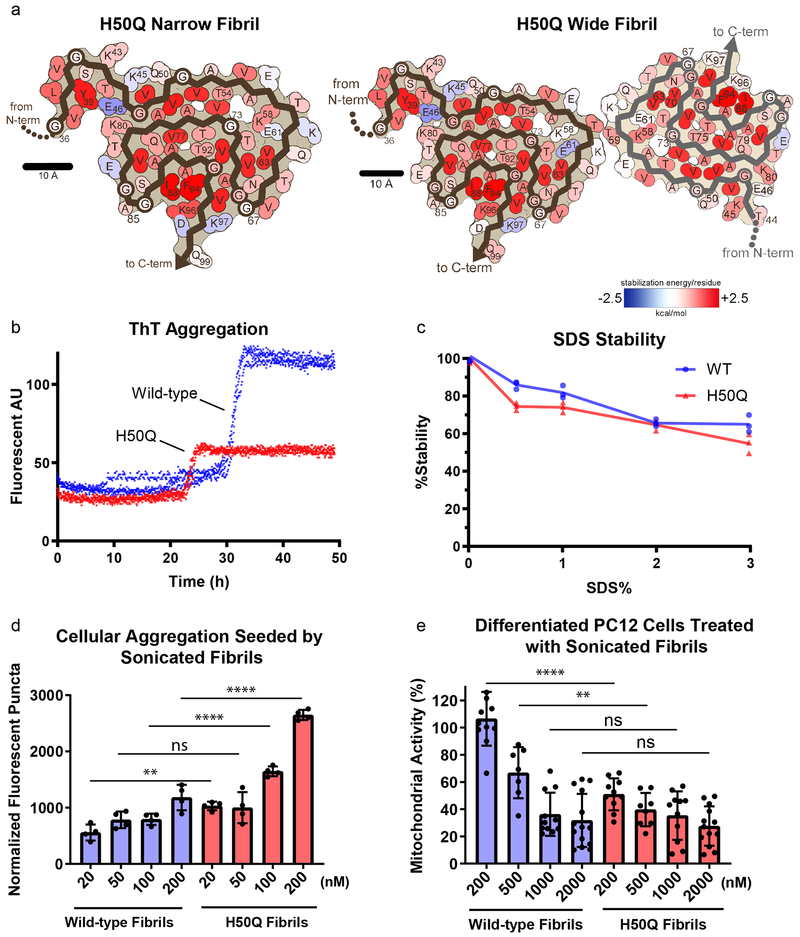
Figure 4.
Solvation energy maps and biochemical characterization of H50Q and wild-type α-syn.
a) Solvation energy maps of H50Q Narrow and Wide Fibrils. The stabilizing residues are red; the de-stabilizing residues are blue. b) ThT assay measuring kinetics of H50Q and wild-type α-syn aggregation. Data from three independent replicates for each sample are shown for each time point. Wild-type aggregation plateaus at 30 h whereas H50Q aggregates faster and plateaus at 23 h. c) Stability assay of H50Q and wild-type α-syn. Fibrils were brought to the indicated concentration of SDS and heated at 70° C for 15 minutes before ThT signal was measured. Both H50Q and wild-type fibrils are irreversible. d) Cell seeding assay of H50Q and wild-type α-syn performed in HEK293T α-syn A53T-YFP biosensor cells. Sonicated fibrils were transfected into biosensor cells using Lipofectamine. After 48 hrs., the number of fluorescent puncta indicating aggregated endogenous α-syn A53T-YFP were counted (see Methods). H50Q fibrils have a higher seeding capacity than wild-type fibrils. Error bars represent standard deviation of four independent measurements. e) MTT toxicity assay of H50Q and wild-type α-syn performed in differentiated PC12 cells. H50Q and wild-type α-syn fibrils were introduced to culture medium and after incubation, cell mitochondrial activity was measured via MTT assay. H50Q requires less fibrils than wild-type to significantly disrupt mitochondrial activity. Error bars represent standard deviation of a minimum of 7 and a maximum of 14 independent measurements. **** = p-value ≤ 0.0001. ** = p-value ≤ 0.01. ns = p-value > 0.05. P-values were calculated using an unpaired, two-tailed t-test with a 95% CI.

