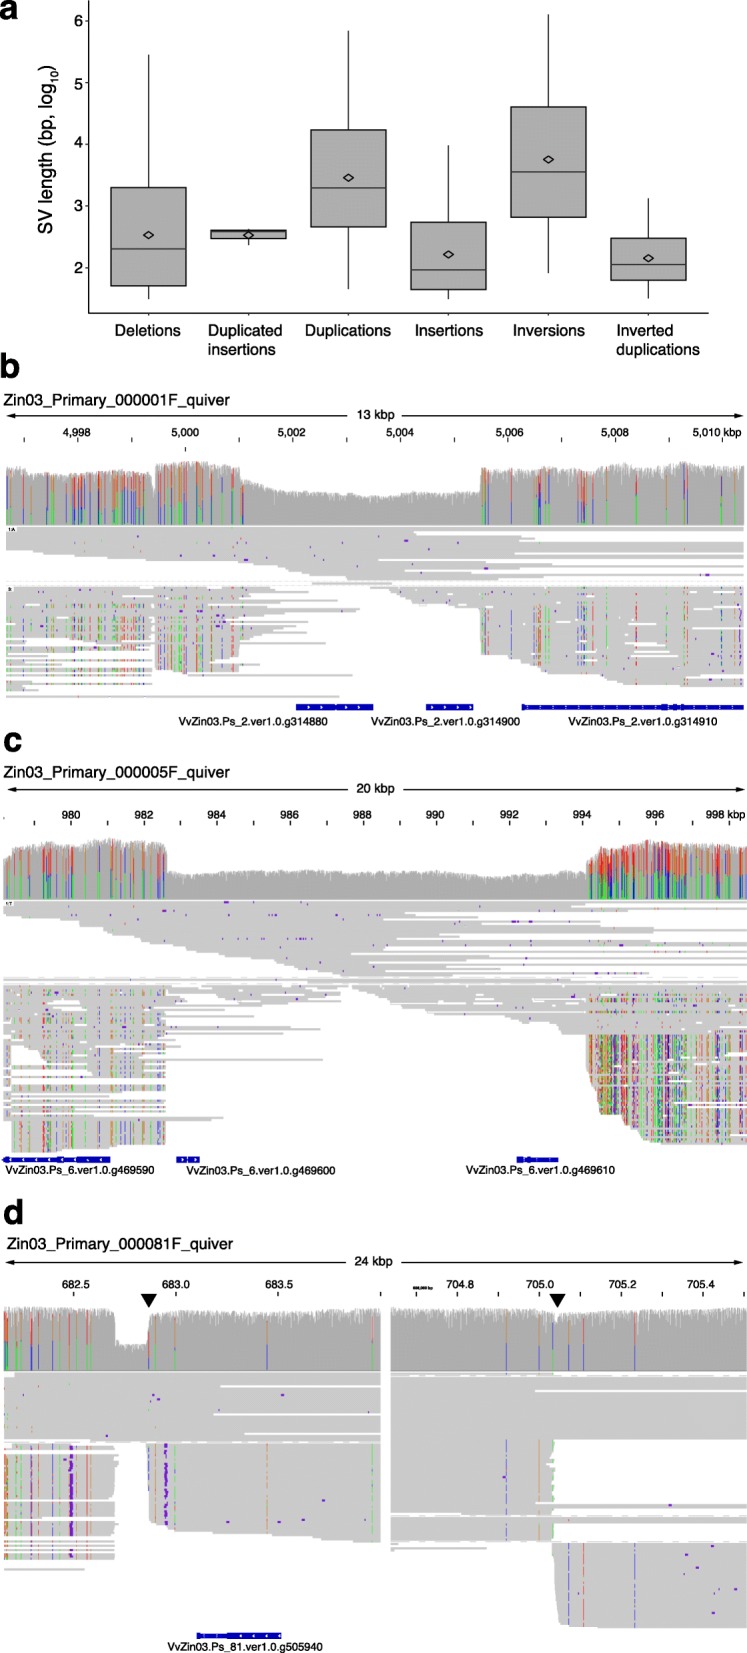
Fig. 1.

Structural variation between Zin03 haplotypes. a. Distribution of structural variation sizes. Boxplots show the 25th quartile, median, and 75th quartile for each type of SV. Whiskers are 1.5Inter-Quartile Range. Diamonds indicate the mean log10(length) of each type of SV; b,c,d. Examples of heterozygous structural variants between haplotypes that intersect genes. For each reported structural variation, (from top to bottom) the coverage, haplotype-resolved alignment of reads, and the genes annotated in the region are shown; b. 4 kbp heterozygous deletion of two genes; c. 11 kbp heterozygous deletion of two genes; d. 22 kbp inversion that intersects a single gene. Triangles indicate boundaries of the inversion. A gap is shown rather than the center of the inverted region
