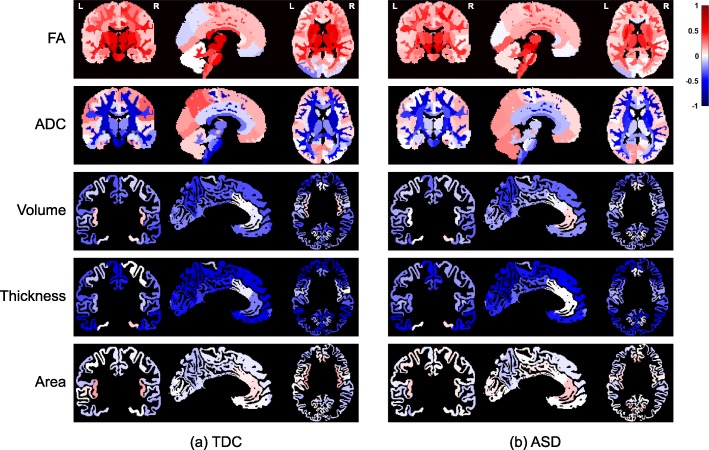
Fig. 2.
Regional patterns of brain maturation for diffusion (FA, ADC) and anatomical (surface area, volume, thickness) metrics, within a TDC and b ASD samples. Colors correspond to Pearson correlation (r) between age and anatomical/diffusion metrics. All regions are color-coded regardless of their p values to better visualize the overall age effects. Note that the brain parcellation used for anatomical metrics included only cortical GM

