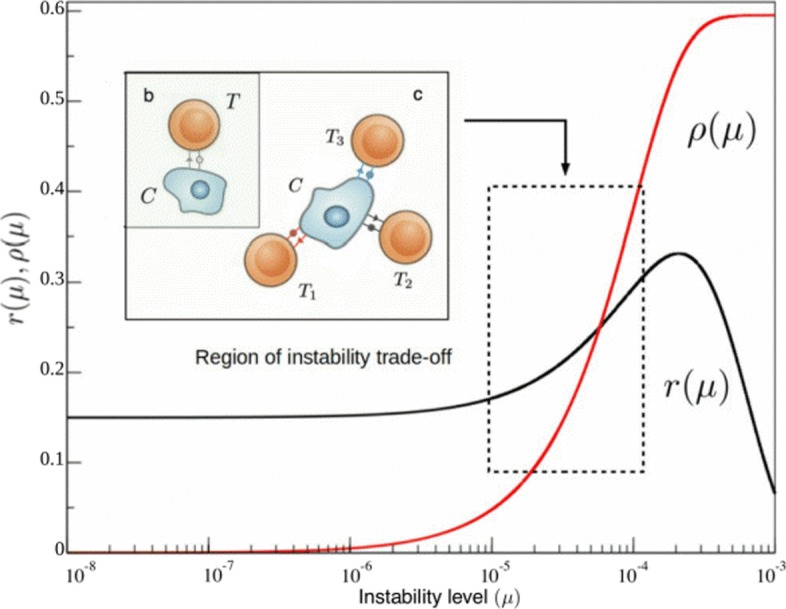
Fig. 3.

Functional forms for cancer replication r(μ) and the adaptive compartment of immune recognition ρT(μ) related to neoantigen presentation. The first (black curve) provides a representation of the cancer instability landscape, as predicted from our theoretical approach (see Methods section) and calibrated by available data. It reveals a very slow increase (in this log-linear diagram) at low instability levels followed by an increase associated to favourable mutations allowing for faster replication and a marked decay at high instabilities due to mutations on viability genes. The immune reactivity to genetic instability function ρ(μ) (in red, obtained from [42]) rises from zero to saturation beyond μ∼10−4. The relevant domain of common cancer instability levels is highlighted. The innate response, ρNK, is not depicted as is not a function of genetic instability and lies in a smaller order of magnitude of around ρNK=2.5×10⁻² [27]
