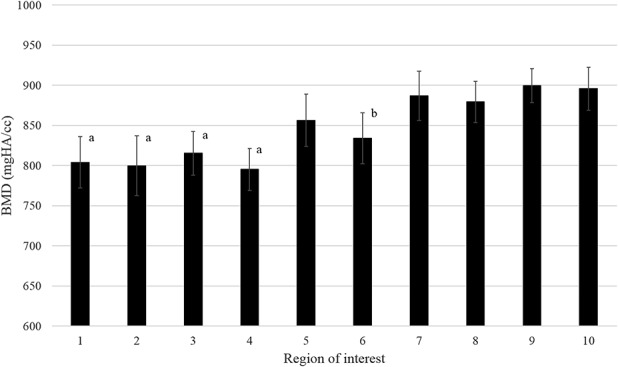
Fig. 2.

The mean BMDs (mg HA/cc) for all regions of interest (ROI) are plotted with associated SD bars. The four most-medial ROI demonstrated greater BMDs than the four most-lateral regions (p < 0.001 for all). Furthermore, ROI 8 and ROI 10 both demonstrated greater BMD than ROI 6 (p < 0.001 for both). aless dense than ROIs 7 to 10; bless dense than ROI 8 and ROI 10.
