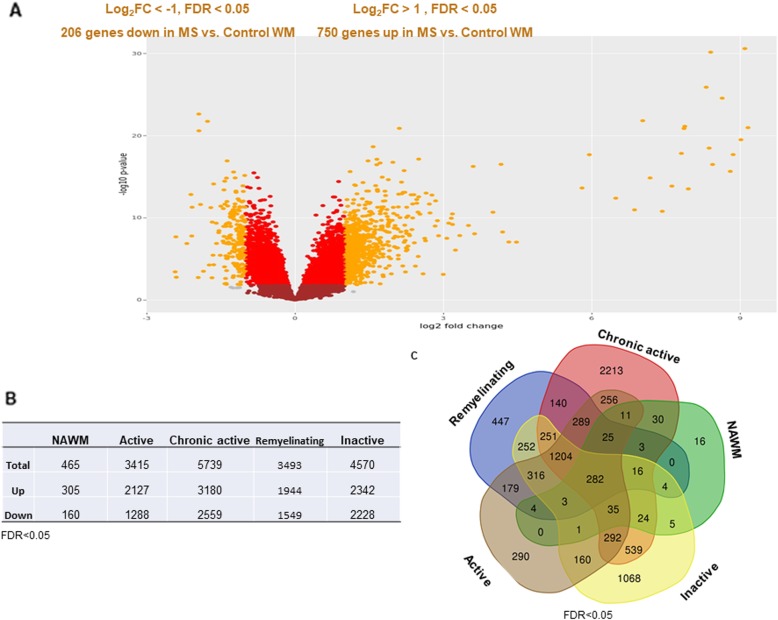
Fig. 2.
Change in gene expression profile during the evolution and fate of WM lesions in progressive MS. a. Visualization of the transcriptional landscape of genes (n = 18,722) detected between MS and non-MS (dots in graph); DEGs are indicated in bright red and orange, where orange indicates log2FC > 1 or < − 1. b. Total number of up- and downregulated DEGs when comparing each lesion type or NAWM to control WM. c. The Venn diagram represents the number of overlapping and lesion-specific DEGs between WM lesion types (active, inactive, remyelinating, chronic active) and NAWM compared to control WM tissue. FDR: false discovery rate; FC: fold change; WM: white matter; NAWM: normal-appearing WM; DEGs: differentially expressed genes (FDR < 0.05)

