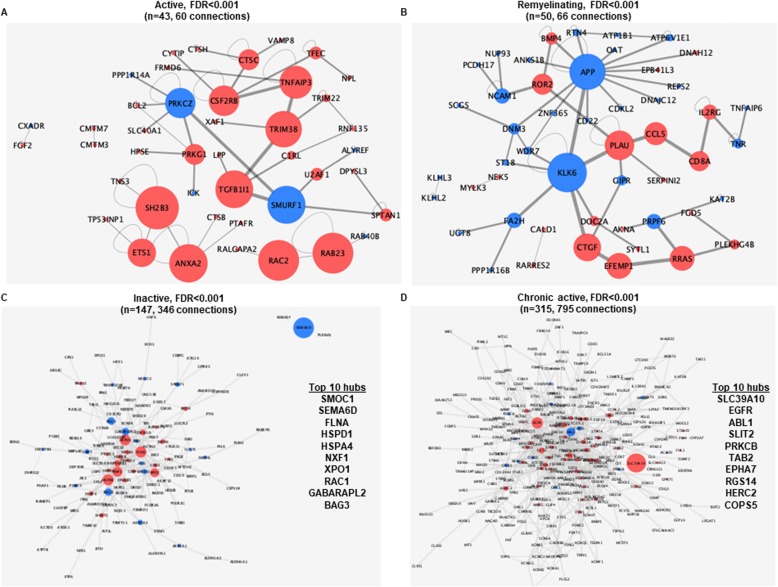
Fig. 6.
Lesion specific signatures and their biggest de novo network enrichment. By using KeyPathwayMiner, we retrieved the biggest de novo brain-specific protein-protein network from each of the lesion-specific gene list ((FDR < 0.001: active = 164, remyelinating = 235, inactive = 484, chronic active = 853) without any exception nodes. a. Forty-three nodes with 60 connections in active lesions. b. Fifty nodes with 66 connections in remyelinating lesions. c. One hundred forty-seven nodes with 346 connections in inactive lesions. d. One hundred fifteen nodes with 795 connections in chronic active lesions. Red color indicates upregulation, while blue color indicates downregulation of the nodes. The size of the node indicates higher betweenness centrality. FDR: false discovery rate

