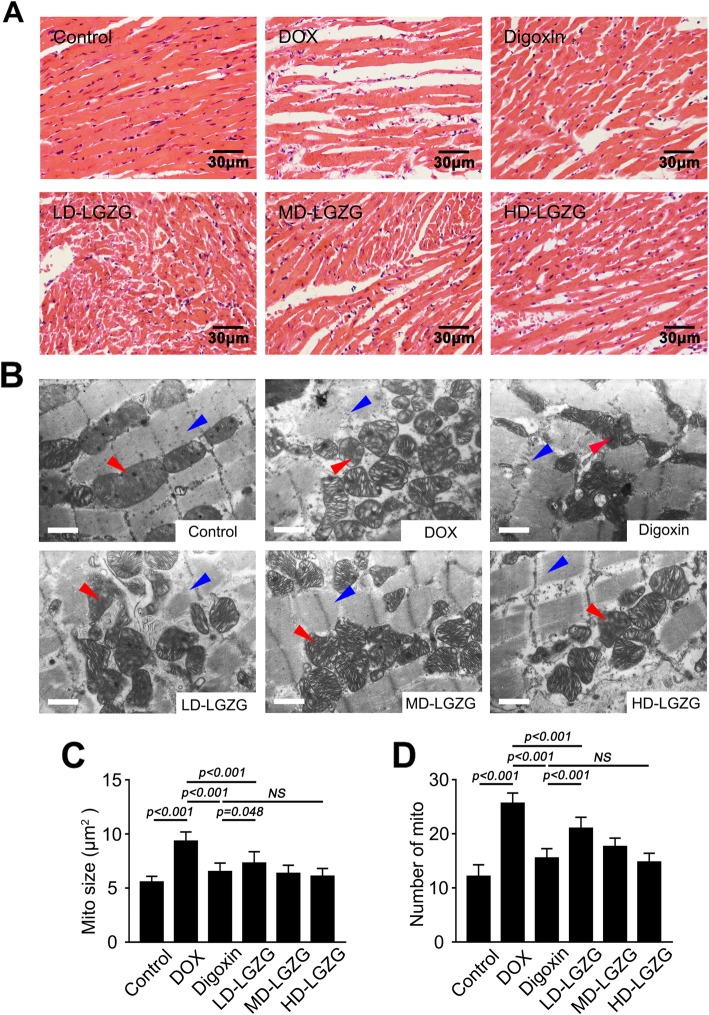
Fig. 3.
LGZG attenuated the changes in myocardial morphology and ultrastructure. (a) Representative images of H&E-stained cardiac tissue. (b) Representative TEM images of cardiac tissue (scale bar, 1 μm). Red arrows, mitochondria; blue arrows, myofibrils. Intermyofibrillar mitochondrial size and number are shown in (c) and (d). Data are mean ± SEM, n = 8. NS, not significant

