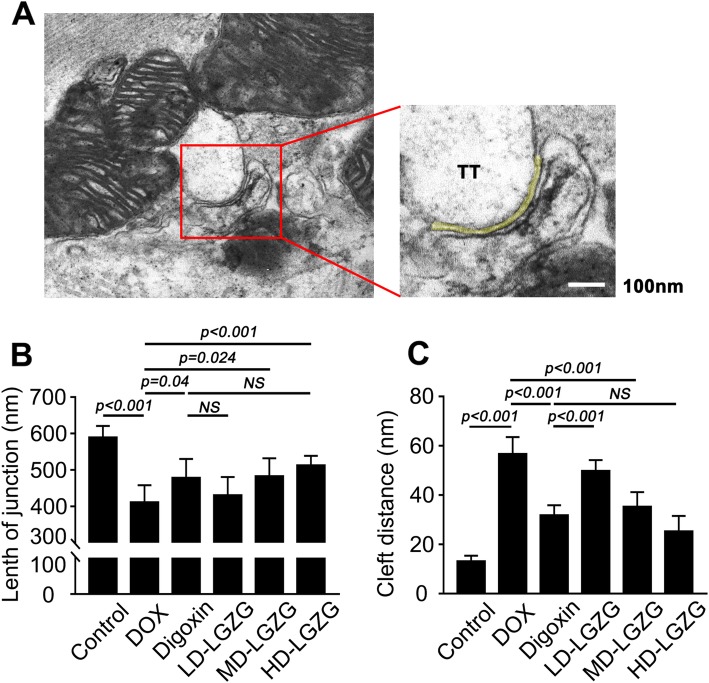
Fig. 4.
LGZG improved TT-SR microstructural remodeling. (a) Representative cardiac TEM images of cardiac tissue from the control group showing selection of a region-of-interest. The junction region (left, red box) was selected and analyzed (right). The TT-SR junctional cleft is marked in yellow. The cleft distance and length of TT-SR junctions were measured as the curvilinear width and length of the yellow line. The average cleft distance and length of junctions are shown in (b) and (c). Data are mean ± SEM, n = 8. NS, not significant

