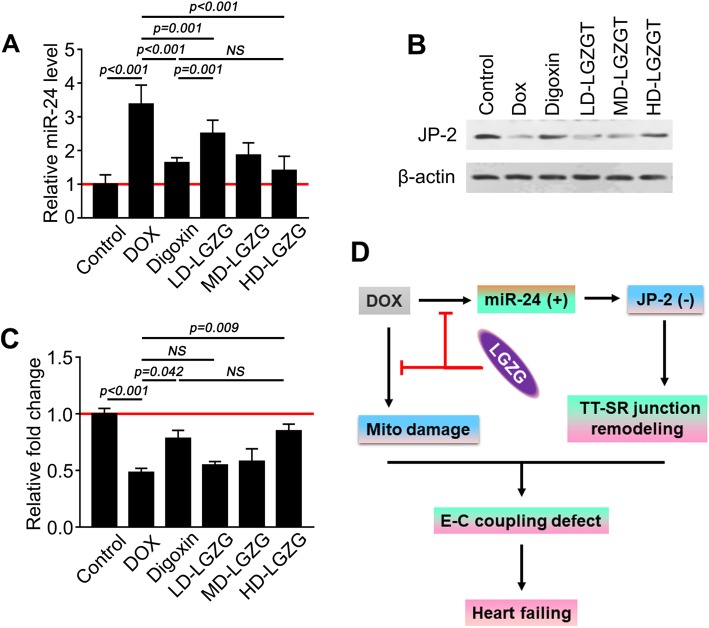
Fig. 5.
The mechanism by which LGZG regulates TT-SR junctions. (a) miR-24 level by quantitative real-time PCR. (b) Western blotting and quantification (c) of JP-2. Values were normalized to the control group. (d) Schematic diagram of the effect of LGZG in the rat model of HF. The experiments were performed in triplicate. Data are mean ± SEM, n = 8. NS, not significant

