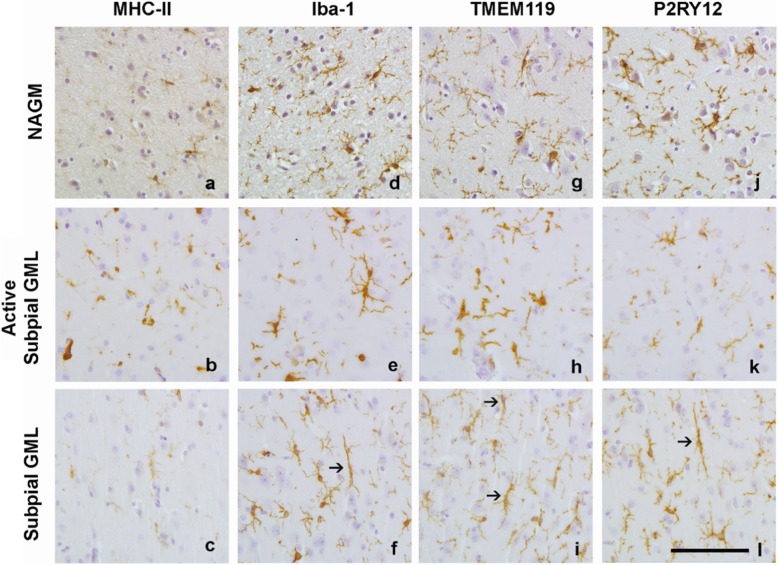
Fig. 3.
Representative images of MHC-II (a, b, c), Iba-1 (d, e, f), TMEM119 (g, h, i) and P2RY12 (i, k,l) immunoreactivity in NAGM, active subpial GMLs and non-active subpial GMLs. Arrows indicate rod-shaped microglia visible in subpial GMLs in Iba-1+ cells (f), TMEM119 + cells (i) and P2RY12+ cells (l). Scalebar = 50 μm

