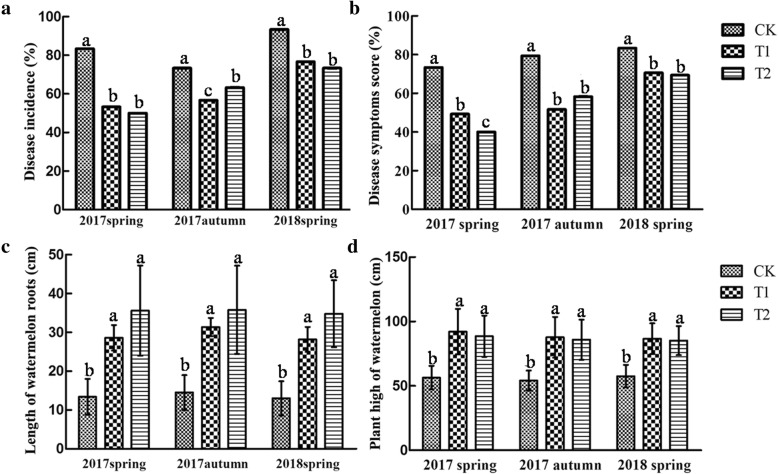
Fig. 1.
Effects of wheat straw addition on the disease incidence (a), disease symptoms score (b), root length (c) and plant height (d) of monoculture watermelon at different times points. The data are the means of 20 replicates, with standard errors shown by the vertical bars. The letters above the bars (a, b, or c) represent the different groups according to Tukey’s test at the p = 0.05 level. CK, without adding wheat straw; T1, addition of 1% wheat straw; T2, addition of 2% wheat straw

