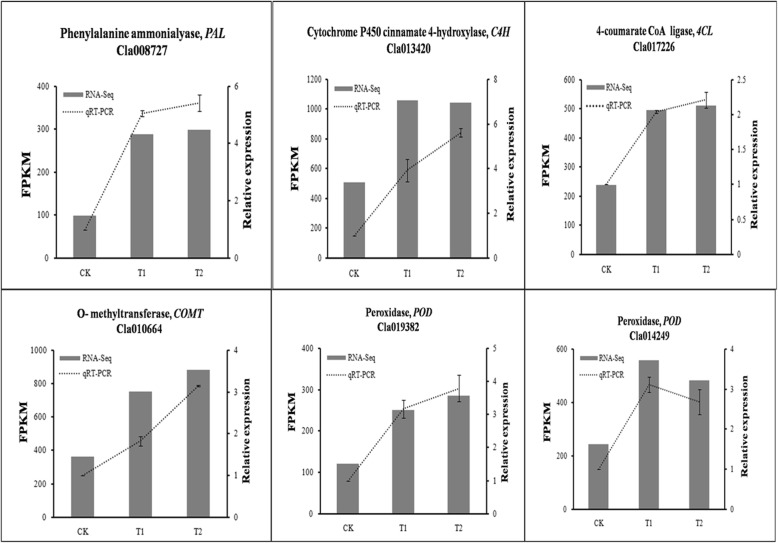
Fig. 3.
Effects of wheat straw addition on the expression levels of lignin biosynthesis in watermelon roots. Y-axis (left) indicates RNA-Seq data; Y-axis (right) indicates qRT-PCR data. Data from qRT-PCR are means of three replicates and bars represent SE. Data from RNA-seq are means of the replicates. CK, without adding wheat straw; T1, addition of 1% wheat straw; T2, addition of 2% wheat straw

