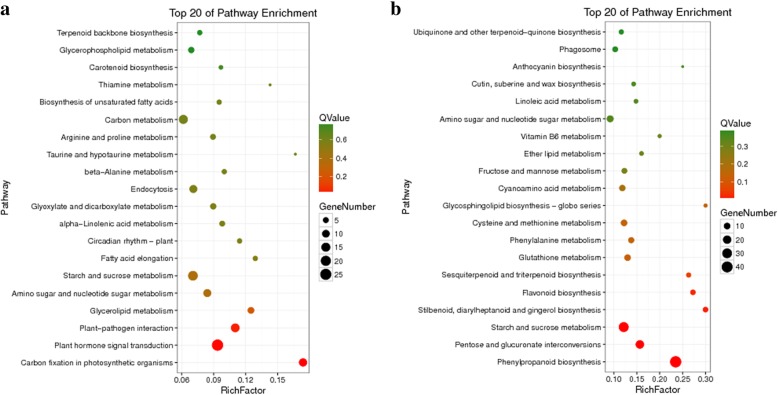
Fig. 8.
Bubble plot of the KEGG pathway enrichment of DEGs. The top 20 of enriched pathways for profile 1 with downregulated patterns (Q value < 0.05) (a) and profile 6 with upregulated patterns (Q value < 0.05) (b). Bubble color and size correspond to the Q value and gene number enriched in the pathway. The rich factor indicates the ratio of the number of DEGs mapped to a certain pathway to the total number of genes mapped to this pathway

