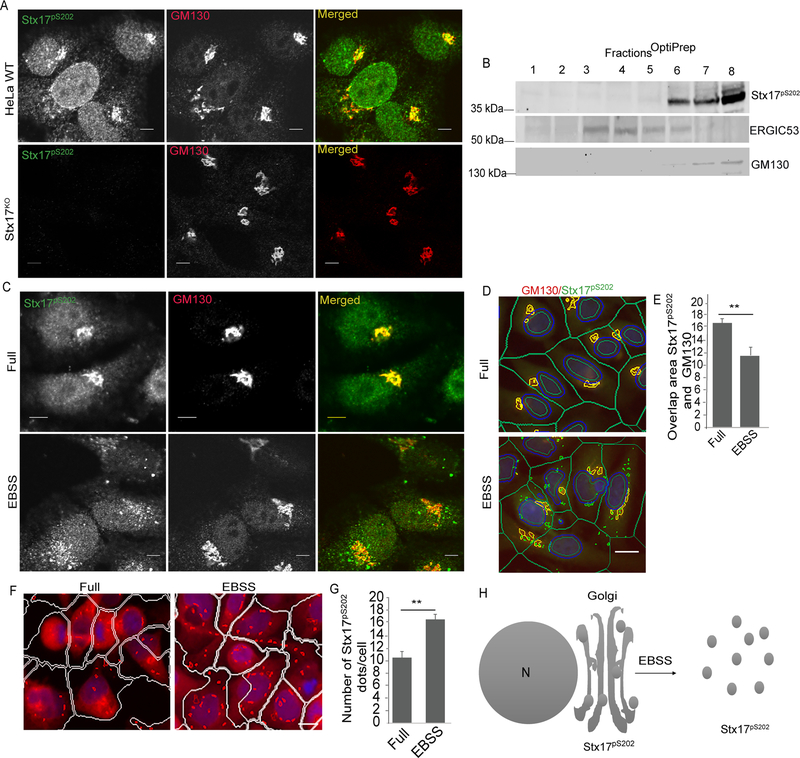
Figure 2. Stx17pS202 is localized in the Golgi.
(A) Confocal microscopy analysis of colocalization between Stx17pS202 and GM130 in WT (upper panel) or Stx17KO HeLa cells (lower panel). (B) Membrane fractionation using OptiPrep gradients to analyze sub cellular fractionation of Stx17pS202. (C) Confocal microscopy analysis of Stx17pS202 redistribution to peripheral puncta in response to autophagy induction by incubation with EBSS for 1h (Lower panel). (D, E) High content microscopy (HC) of HeLa cells showing colocalization between Stx17pS202 and GM130 in full and starved (1h EBSS) conditions. **, p < 0.01, (n=3) t-test, from 3 independent experiments (>500 primary object examined per well; minimum number of wells, 30). Green masks, algorithm-defined cell boundaries (primary objects); yellow masks, computer-identified overlap between Stx17pS202 and GM130 (target objects); green masks, computer-identified Stx17pS202 dots. Images, a detail form a large database of machine-collected and computer-processed images. (F, G) High content microscopy and quantification to analyze the redistribution of Stx17pS202 to peripheral puncta in response to autophagy induction by starvation. **, p < 0.01, (n=3) t-test. from 3 independent experiments (>500 primary object examined per well; minimum number of wells, 30). White masks, algorithm-defined cell boundaries (primary objects); yellow masks, computer-identified Stx17pS202 dots. Images, a detail form a large database of machine-collected and computer-processed images. (H) A model depicting translocation of Stx17pS202 from Golgi to peripheral puncta upon induction of autophagy with starvation. Scale bars: confocal images 5 μm; HC images, 10 μm. See also Figure S2.

