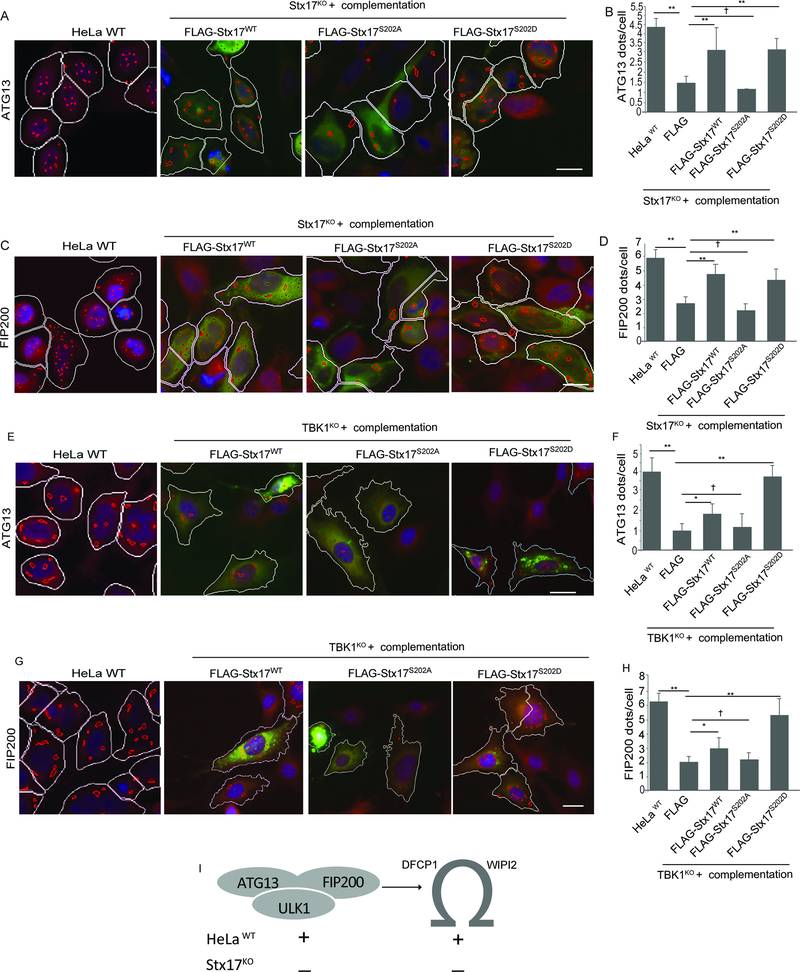
Figure 4. Phosphorylation of Stx17 by TBK1 is required for formation of ATG13 and FIP200 puncta.
(A,B) HC analysis of effect of complementation of Stx17KO cells with FLAG-Stx17WT, FLAG-Stx17S202A and FLAG-Stx17S202D on formation of ATG13 dots in response to autophagy induction by incubation with EBSS for 1h. White masks, computer-identified FLAG positive cells (primary objects); red masks, computer-identified ATG13 dots in FLAG transfected cells. HeLa WT (left) were left un-transfected for control. (Scale bar 10 μm). **, p < 0.01, (n=3) ANOVA. (C,D) HC analysis to analyze the effect of complementation of Stx17KO with FLAG-Stx17 WT, FLAG-Stx17S202A and FLAG-Stx17S202D on formation of FIP200 dots in response to autophagy induction by incubation with EBSS for 1h. White masks, computer-identified FLAG positive cells (primary objects); red masks, computer-identified FIP200 dots in FLAG transfected cells. Scale bar 10 μm. **, p < 0.01, (n=3) ANOVA. (E,F). HC analysis of effect of cross-complementation of TBK1KO cells with FLAG-Stx17WT, FLAG-Stx17S202A and FLAG-Stx17S202D on formation of FIP200 dots in response to autophagy induction by incubation with EBSS for 1h. White masks, computer-identified FLAG positive cells (primary objects); red masks, computer-identified ATG13 dots in FLAG transfected cells.White masks, computer-identified FLAG positive cells (primary objects); red masks, computer-identified ATG13 dots in FLAG transfected cells. Scale bar 10 μm. **, p < 0.01, (n=3) ANOVA. (G,H) HC analysis of effect of cross-complementation of TBK1KO cells with FLAG-Stx17WT, FLAG-Stx17S202A and FLAG-Stx17S202D on formation of FIP200 dots in response to autophagy induction by incubation with EBSS for 1h. White masks, computer-identified FLAG positive cells (primary objects); red masks, computer-identified ATG13 dots in FLAG transfected cells. Scale bar 10 μm. **, p < 0.01, (n=3) ANOVA. (I) A model depicting the effect of Stx17 on formation of mammalian pre-autophagosomal structures and omegasomes. In HC experiments (A-H), Images are details from a large database of machine-collected and computer-processed images; data are from 3–5 independent experiments (>500 primary object examined per well; minimum number of wells, 12). See also Figure S4.

