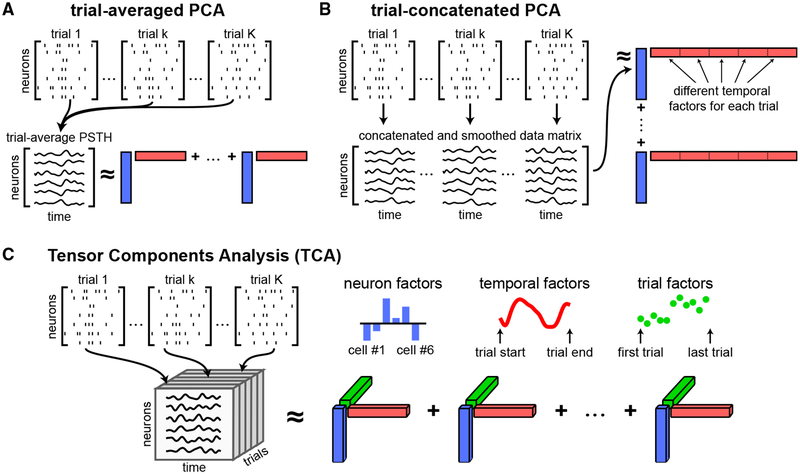
Figure 1. Tensor Representation of Trial-Structured Neural Data.
(A) Schematic of trial-averaged PCA for spiking data. The data are represented as a sequence of N×T matrices (top). These matrices are averaged across trials to build a matrix of trial-averaged neural firing rates. PCA approximates the trial-averaged matrix as a sum of outer products of vectors (Equation 1). Each outer product contains a neuron factor (blue rectangles) and a temporal factor (red rectangles).
(B) Schematic of trial-concatenated PCA for spiking data. Data may be temporally smoothed (e.g., by a Gaussian filter) to estimate neural firing rates before concatenating all trials along the time axis. Applying PCA produces a separate set of temporal factors for each trial (subsets of the red vectors).
(C) Schematic of TCA. Data are organized into a third-order tensor with dimensions N × T × K. TCA approximates the data as a sum of outer products of three vectors, producing an additional set of low-dimensional factors (trial factors, green vectors) that describe how activity changes across trials.

