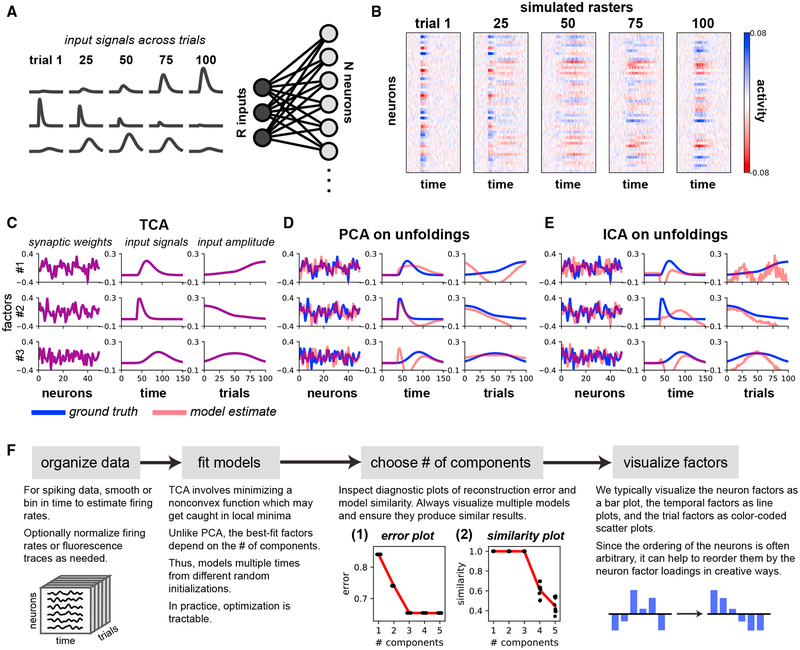
Figure 2. TCA Precisely Recovers the Parameters of a Linear Model Network.
(A) A gain-modulated linear network, in which R = 3 input signals drive N = 50 neurons by linear synaptic connections. Gaussian noise was added to the output units.
(B) Simulated activity of all neurons on example trials.
(C) The factors identified by a three-component TCA model precisely match the network parameters.
(D and E) Applying PCA (D) or ICA (E) to each of the tensor unfoldings does not recover the network parameters.
(F) Analysis pipeline for TCA. Inset 1: error plots showing normalized reconstruction error (vertical axis) for TCA models with different numbers of components (horizontal axis). The red line tracks the minimum error (i.e., best-fit model). Each black dot denotes a model fit from different initial parameters. All models fit from different initializations had essentially identical performance. Reconstruction error did not improve after more than three components were included. Inset 2: similarity plot showing similarity score (STAR Methods; vertical axis) for TCA models with different numbers of components (horizontal axis). Similarity for each model (black dot) is computed with respect to the best-fit model with the same number of components. The red line tracks the mean similarity as a function of the number of components. Adding more than three components caused models to be less reliably identified.

