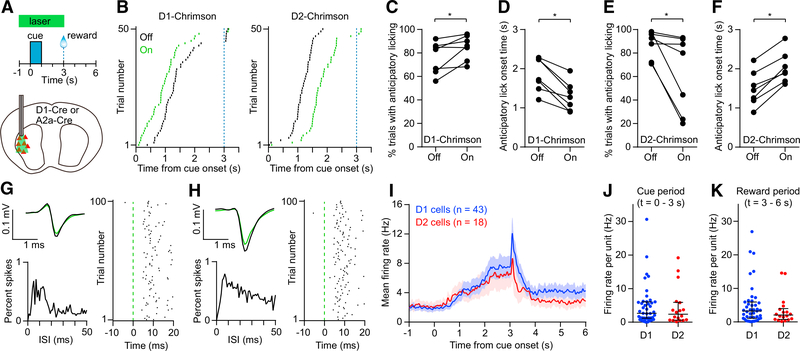
Figure 1. D1 and D2 MSNs Drive Opposing Behavioral Effects and Show Balanced Activity in a Reward-Conditioned Licking Task.
(A) Top: schematic of Pavlovian conditioning task in which an olfactory cue is paired with a reward. The green bar indicates the timing of the optical stimulus used to activate D1 or D2 MSNs in (B)–(F). Light was delivered on 50% of trials in random order. Bottom: optogenetic stimulation of D1 and D2 MSNs was carried out unilaterally in the lateral striatum.
(B) Lick rasters for a representative D1-Cre mouse (left) and A2a-Cre mouse (right). Green and black denote trials with laser on and off, respectively. Only the first lick in each trial is shown. The dashed blue line indicates the reward time.
(C) Activating D1 MSNs significantly increased the probability of anticipatory licking (n = 7, Wilcoxon signed rank test, p = 0.031).
(D) Activating D1 MSNs significantly reduced the anticipatory licking onset time (n = 7, Wilcoxon signed rank test, p = 0.016).
(E) Activating D2 MSNs significantly reduced the probability of anticipatory licking (n = 7, Wilcoxon signed rank test, p = 0.016).
(F) Activating D2 MSNs significantly increased the anticipatory licking onset time (n = 7, Wilcoxon signed rank test, p = 0.016).
(G) Optogenetically tagged D1 receptor-expressing cell. Top left: mean spike waveform on trials with laser on (green) and off (black). Bottom left: interspike interval (ISI) distribution. Right: spike raster aligned to laser onset.
(H) Same as (G) but for an optogenetically tagged D2 receptor-expressing cell.
(I) Mean firing rate versus time aligned to cue onset of 43 tagged D1 cells and 18 tagged D2 cells. Data represent mean ± SEM.
(J) Median firing rate of individual tagged D1 and D2 cells was not significantly different in the cue period (Mann-Whitney test, p = 0.62).
(K) Median firing rate of individual tagged D1 and D2 cells was not significantly different in the reward period (Mann-Whitney test, p = 0.37).
Lines and error bars in (J) and (K) represent median and interquartile range (IQR).
See also Figure S1.

