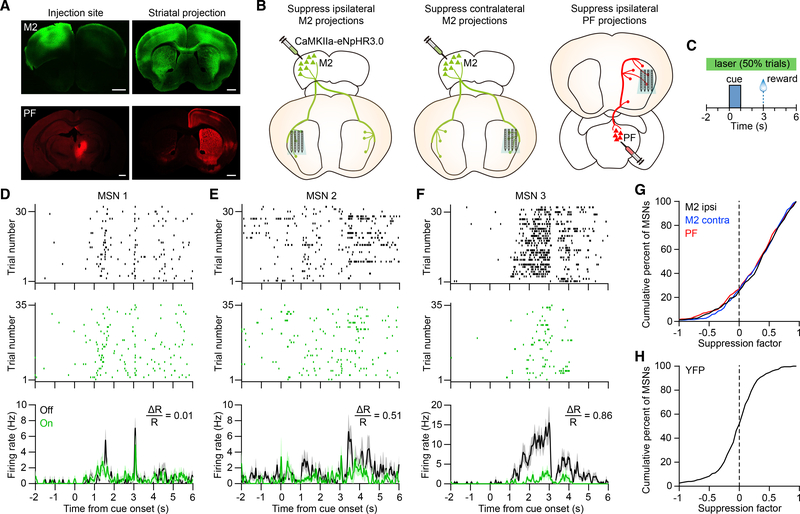
Figure 2. Deconstructing the Cortical and Thalamic Contributions to Striatal Dynamics.
(A) Anterograde projections from M2 (green) and PF (red) in the striatum. M2 and PF projections were obtained from different animals. Scale bars, 1 mm.
(B) Approach used to determine the contribution of three individual excitatory inputs (ipsilateral M2, contralateral M2, and ipsilateral PF) on behaviorally evoked activity in the striatum. The opto-microprobe for recording neural activity and delivering light to suppress terminals is inserted in the lateral striatum.
(C) Schematic of optical stimulation during the task. Light was delivered on 50% of trials in random order.
(D) Spike raster and mean firing rate of an MSN on anticipatory licking trials with laser on (green) and off (black). The unit’s suppression factor is 0.01.
(E) Same as (D) but for a different MSN with a suppression factor of 0.51.
(F) Same as (D) but for a different MSN with a suppression factor of 0.86. Data in (D)–(F) are from the ipsilateral M2 group, and firing rate plots represent mean ± SEM.
(G) Cumulative distribution of the MSN suppression factor for the ipsilateral M2 (black), contralateral M2 (blue), and PF (red) input groups. The median value was significantly higher than zero in each group (Wilcoxon signed rank test, p < 0.0001). The median suppression factor was 0.4 for ipsilateral M2 (n = 298 MSNs from 9 mice), 0.37 for contralateral M2 (n = 255 MSNs from 9 mice), and 0.36 for PF (n = 344 MSNs from 9 mice).
(H) Cumulative distribution of the MSN suppression factor for the YFP control group. The median value (equal to 0.04) was not significantly different from zero(n = 227 MSNs from 8 mice, Wilcoxon signed rank test, p = 0.2).
Suppression factors in (D)–(H) were calculated in the period from −2 to 6 s relative to cue onset.
See also Figure S2.

