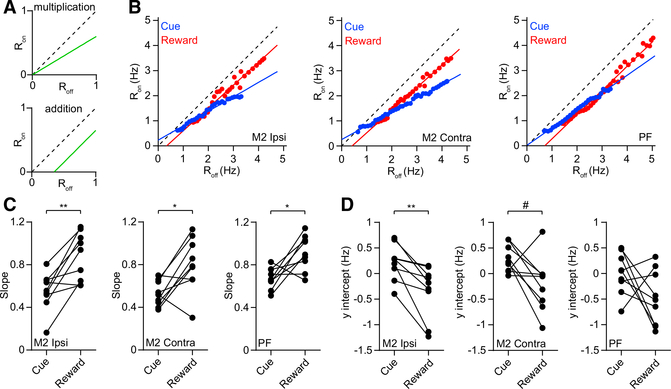
Figure 4. Differential Gain in the Cue and Reward Periods.
(A) Response of firing rate during laser on trials as a function of rate during laser off trials (Ron versus Roff) for hypothetical purely multiplicative (top) and additive (bottom) transformations. The gain is equivalent to the slope of the line. The dashed line indicates the diagonal with a slope of one.
(B) Ron versus Roff calculated from the pooled population of MSNs from the ipsilateral M2 group (left), contralateral M2 group (middle), and PF input group (right). Blue and red represent data from the cue and reward periods, respectively. The solid lines represent linear fits to the data.
(C) Slope of the line was significantly lower in the cue compared with the reward period for the ipsilateral M2 group (n = 9, Wilcoxon signed rank test, p = 0.008), contralateral M2 group (n = 9, p = 0.027), and PF group (n = 9, p = 0.02). For each input group, the cue period slope was significantly less than one (Wilcoxon signed rank test, p = 0.004). For the ipsilateral M2 and PF groups, the reward period slope was not significantly different from one (p = 0.25). For the contralateral M2 group, the reward period slope was significantly less than one (p = 0.039).
(D) The y intercept of the line was significantly lower in the reward period compared with the cue period for the ipsilateral M2 group (n = 9, Wilcoxon signed rank test, p = 0.004). The contralateral M2 group showed a trend toward significance (n = 9, p = 0.055). The PF group showed no significant difference (n = 9, p = 0.098). For the ipsilateral M2 and PF input groups, the cue period y intercept was not significantly different from zero (Wilcoxon signed rank test, p = 0.13 and p > 0.99, respectively). For the contralateral M2 group, the cue period y intercept was significantly greater than zero (p = 0.008). For the ipsilateral and contralateral M2 groups, the reward period y intercept was not significantly different from zero (p = 0.074 and p = 0.098, respectively). For the PF group, the reward period y intercept was significantly less than zero (p = 0.039).
See also Figure S3.

