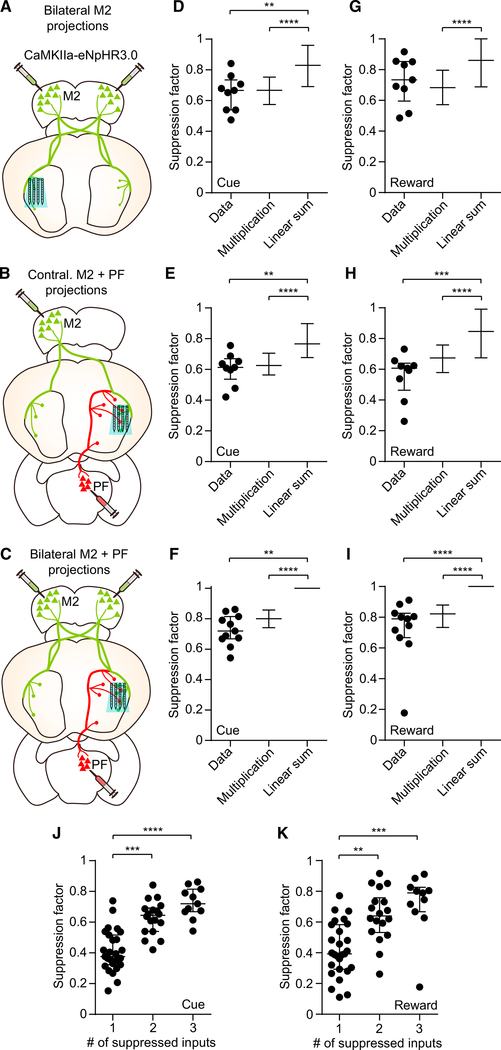
Figure 5. A Multiplication-like Rule for Combining Corticostriatal and Thalamostriatal Input Signals.
(A) Approach used to determine the combined contribution of two inputs corresponding to bilateral M2 on striatal activity.
(B) Approach used to determine the combined contribution of two inputs corresponding to contralateral M2 plus PF on striatal activity. (C) Approach used to determine the combined contribution of three inputs corresponding to bilateral M2 plus PF on striatal activity.
(D) Comparison of the cue period suppression factor observed from the bilateral M2 group (n = 9 in Data) to a model of individual input multiplication and linear summation (Kruskal-Wallis test, H = 40.29, p < 0.0001). Post hoc Dunn’s multiple comparison test showed that for data versus multiplication model, p > 0.99; data versus summation model, p = 0.008; and multiplication versus summation model, p < 0.0001.
(E) Same as (D) but from the contralateral M2 plus PF group (n = 9 in Data, Kruskal-Wallis test, H = 39.14, p < 0.0001). Post hoc Dunn’s multiple comparison test showed that for data versus multiplication model, p > 0.99; data versus summation model, p = 0.005; and multiplication versus summation model, p < 0.0001.
(F) Same as (D) but from the bilateral M2 plus PF group (n = 11 in Data, Kruskal-Wallis test, H = 1,074, p < 0.0001). Post hoc Dunn’s multiple comparison test showed that for data versus multiplication model, p = 0.6; data versus summation model, p < 0.0001; and multiplication versus summation model, p < 0.0001. The lack of apparent error bars in the linear summation models in (F) and (I) occurs because most suppression factor values were capped at one.
(G) Comparison of the reward period suppression factor observed from the bilateral M2 group to a model of input multiplication and linear summation (n = 9 in Data, Kruskal-Wallis test, H = 28.87, p < 0.0001). Post hoc Dunn’s multiple comparison test showed that for data versus multiplication model, p > 0.99; data versus summation model, p = 0.36; and multiplication versus summation model, p < 0.0001.
(H) Same as (G) but from the contralateral M2 plus PF group (n = 9 in Data, Kruskal-Wallis test, H = 37.58, p < 0.0001). Post hoc Dunn’s multiple comparison test showed that for data versus multiplication model, p = 0.29; data versus summation model, p = 0.0001; and multiplication versus summation model, p < 0.0001.
(I) Same as (G) but from the bilateral M2 plus PF group (n = 11 in Data, Kruskal-Wallis test, H = 854, p < 0.0001). Post hoc Dunn’s multiple comparison test showed that for data versus multiplication model, p = 0.6; data versus summation model, p < 0.0001; and multiplication versus summation model, p < 0.0001.
(J) Cue period suppression factor varied significantly as a function of the number of simultaneously suppressed inputs (n = 27 single, 18 double, and 11 triple inputs; Kruskal-Wallis test, H = 31.11, p < 0.0001). Post hoc Dunn’s multiple comparison test showed that for 1 versus 2 inputs, p = 0.002; 1 versus 3 inputs, p < 0.0001; and 2 versus 3 inputs, p = 0.35.
(K) Same as (J) but for the reward period (Kruskal-Wallis test, H = 21.55, p < 0.0001). Post hoc Dunn’s multiple comparison test showed that for 1 versus 2 inputs, p = 0.002; 1 versus 3 inputs, p = 0.0001; and 2 versus 3 inputs, p = 0.77).
Lines and error bars in (D)–(K) represent median and IQR.
See also Figures S4 and S5.

