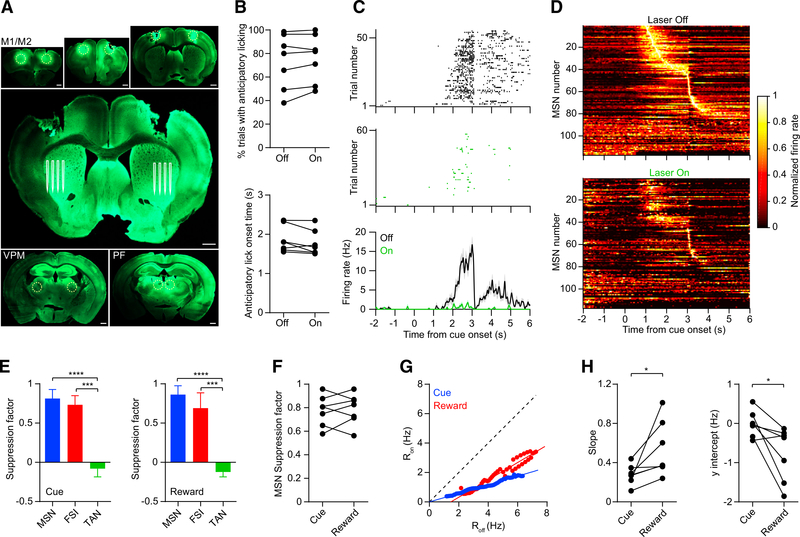
Figure 7. Striatal Activity during Widespread Cortical and Thalamic Input Suppression.
(A) Viral injection locations in M1, M2, VPM, and PF (dashed yellow circles in the small panels) and approximate region of the silicon microprobe electrodes in the striatum (white lines in the large panel). Because injections were bilateral, in some animals, we performed recordings on both striatal hemispheres (one hemisphere per session). Scale bars, 0.5 mm.
(B) Suppressing these inputs in the striatum did not significantly alter anticipatory licking probability (top: n = 7 recording sessions, maximum one session per hemisphere, Wilcoxon signed rank test, p = 0.22) or onset time (bottom: p = 0.11).
(C) Spike raster and mean firing rate of an MSN on anticipatory licking trials with laser on (green) and off (black). The neuron’s suppression factors are 0.93 and 0.98 in the cue and reward periods, respectively.
(D) Mean normalized firing rate as a function of time of 117 MSNs pooled from 7 recording sessions. Top and bottom plots show data from laser off and on trials, respectively. Each unit’s firing rate is normalized by the maximum rate during laser off trials. The units are ordered by their latency to peak firing.
(E) Median suppression factor of all 117 MSNs, 20 FSIs, and 32 TANs pooled from 7 recording sessions. Left: cue period (Kruskal-Wallis test, H = 72, p < 0.0001). Post hoc Dunn’s multiple comparison tests showed that for MSN versus FSI, p = 0.07; MSN versus TAN, p < 0.0001; and FSI versus TAN, p = 0.0002. Right: reward period (Kruskal-Wallis test, H = 67, p < 0.0001). Post hoc Dunn’s multiple comparison tests showed that for MSN versus FSI, p = 0.08; MSN versus TAN, p < 0.0001; and FSI versus TAN, p = 0.0004. Error bars represent IQR.
(F) Median MSN suppression factor per subject was not significantly different between the cue and the reward periods (n = 7, Wilcoxon signed rank test, p = 0.99).
(G) Ron versus Roff calculated from the pooled population of MSNs. Blue and red represent data from the cue and reward periods, respectively. The solid lines represent linear fits to the data.
(H) Left: the slope was significantly lower in the cue period compared with the reward period (n = 7, Wilcoxon signed rank test, p = 0.02). In both periods, the slope was significantly less than one (Wilcoxon signed rank test; cue, p = 0.02; reward, p = 0.03). Right: the y intercept of the line was significantly lower in the reward period compared with the cue period (Wilcoxon signed rank test, p = 0.03). The y intercept was not significantly different from zero in the cue period (Wilcoxon signed rank test, p = 0.69), but it was significantly less than zero in the reward period (p = 0.02).

