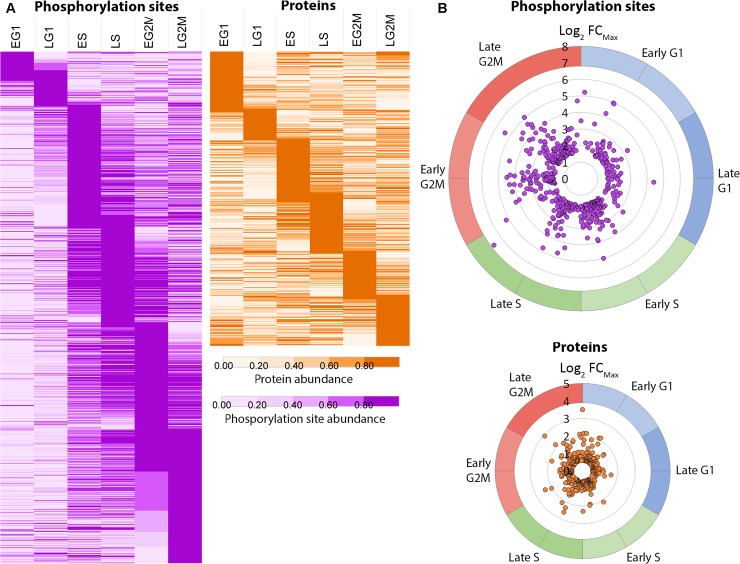
Fig 2. Cell cycle regulated phosphorylation sites and proteins.
A. Species ordered in increasing peak time (tpeak) and rendered as a heat map of fold change scaled to the unit integer. B. CCR species projected on a polar plot of peak time tpeak (angle of polar coordinate) versus the maximum fold change FCMax.(distance from the centre). Five phosphorylation sites showing > 100-fold change were excluded for clarity.

