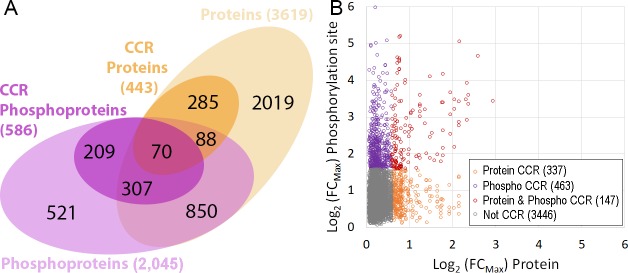
Fig 3. Comparison of cell cycle regulated phosphorylation sites and proteins.
A. Venn diagram of overlap at the protein level (proteins and phosphoproteins). B. Scatter plot of overlap at the phosphorylation site level (proteins versus phosphorylation sites); Grey, not CCR; Purple, phosphorylation site CCR; Orange, protein CCR; Red, protein and phosphorylation site CCR.

