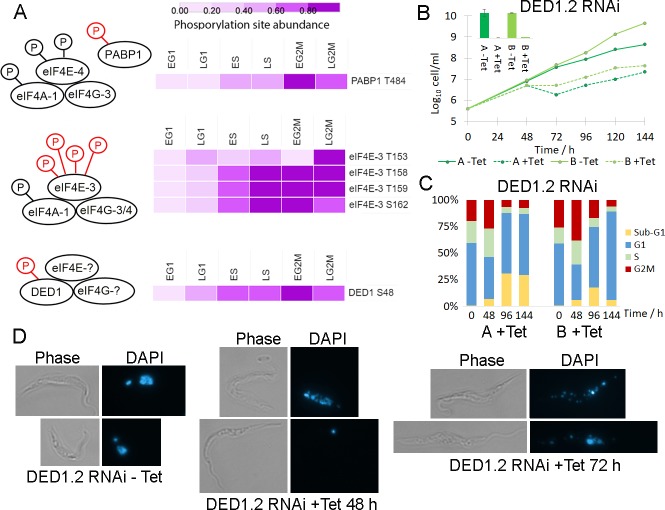
Fig 7. Dynamic phosphorylation of the translational machinery.
A. Schematic of eIF4F complexes with CCR phosphorylation sites rendered as a heat map of fold change scaled to the unit integer. The components bound to DED1 have not been identified in T. brucei. B. Cumulative growth curve of tetracycline inducible RNAi of DED1.2 in two independent clones, with qRT-PCR inset confirming ablation of DED1.2 mRNA at 48h. C. Flow cytometry analysis of DNA content of DED1.2 RNAi time course shows accumulation of a sub-G1 population. D. Microscopy of DAPI stained DED1.2 RNAi time course shows disintegration of nuclear integrity.

