
Fig 4. Biochemical values (mean ± SEM) of dyslipidemic rats fed cashew nut.
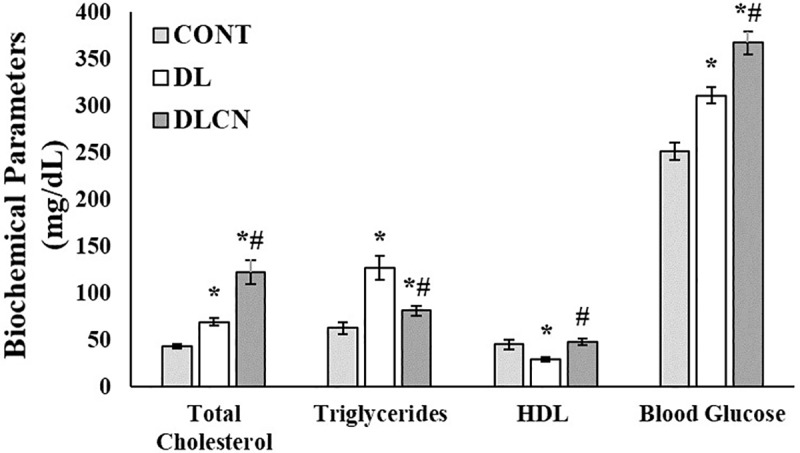
CONT = Control group, DL = Dyslipidemic group, DLCN = Dyslipidemic Cashew Nut group. * versus CONT, # versus DL; For all groups, p < 0.05 was considered a significant difference as determined by One-Way ANOVA followed by the Tukey test.