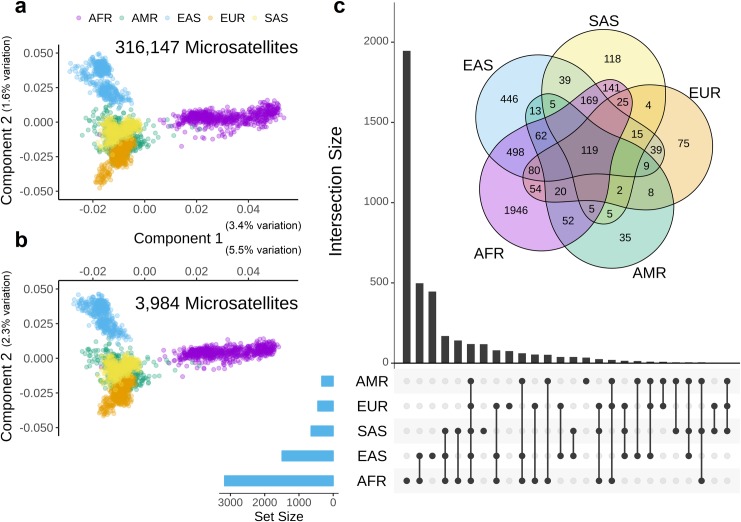
Fig 1. Discovery and analysis of EBML.
a, Principal component analysis of 316,147 genome wide microsatellites reveals a distinct pattern of variation in 5 super-populations (ethnicities). b, Principal component analysis of 3,984 EBML reveals a pattern of variation similar to genome wide microsatellites. c, Number of EBML identified in five ethnicities: UpSet plot inset with 5-way Venn Diagram. Overlap indicates microsatellites specific to two or more ethnicities. Oval regions sum to 3,171 (AFR); 1,494 (EAS); 450 (EUR); 647 (SAS); and 335 (AMR). All regions sum to 3,984: the total number of EBML identified in this study.

