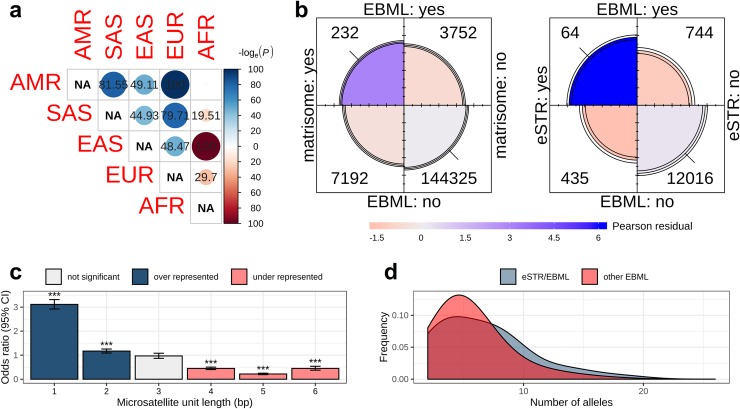
Fig 2. Summary of significant enrichments in the set of 3,984 EBML.
a, EBML for each of the 10 super-population pairs were used to construct a 2x2 contingency table followed by χ2 test of independence: matrix entries shown as -log(p-value). Each matrix entry corresponds to a test of the null: that EBML are independent in the pair of super-populations. Over-representation shown in blue; under-representation shown in red. With the exception of AFR, microsatellites specific to two or more super-populations are over-represented. b, Fourfold plots of EBML reveal significant overlap with matrisome genes (left) and eSTRs (right). Area of each quarter circle is proportional to the cell frequency (following marginal standardization). Color of each quarter circle corresponds with its Pearson residual: blue indicates the cell entry exceeds the expected value; red indicates less than then expected value. Confidence rings for the odds ratio allow a visual test of the null (no association); here, 99% confidence rings do not overlap indicating the null is rejected. c, EBML are enriched with 1-mer and 2-mer repeats. Enrichments for each unit length were checked by constructing a 2x2 contingency table followed by χ2 test of independence. Bars show the odds ratio with 95% confidence interval: over-represented motifs shown in blue; under-represented motifs shown in red. Level of significance (p-value) is indicated symbolically: p<0.05 (*); p<0.01 (**); p<0.001 (***). d, The 64 EBML known to affect gene expression (eSTRs) have more alleles on average than the remaining 3,920 EBML; smoothed distribution of allele counts shown in blue and red, respectively. The difference is statistically significant (p = 0.01; two sided Kolmogorov-Smirnov test).

