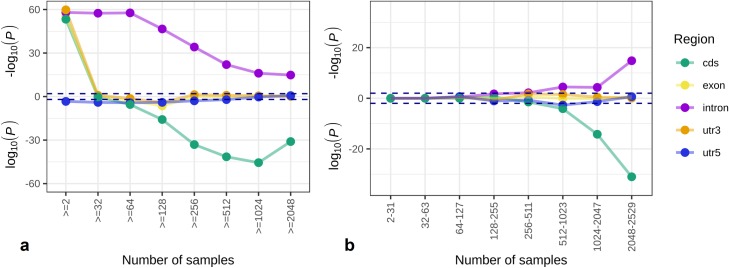
Fig 3. Enrichment analysis of EBML with respect to gene regions: Introns, exons, coding sequences, and UTRs.
Analysis of microsatellites draws upon whole exome sequenced samples from the 1000 Genomes Project; consequently, enrichment with respect to gene regions could not be checked by directly comparing all 316,147 tested microsatellites to the 3,984 EBML. Instead, two series of enrichment tests are performed on subsets of the tested and EBML. a, In the first series, each iteration removes microsatellites based on the minimum number of available samples. b, In the second series, each iteration considers microsatellites within a range of available samples. Each point represents a χ2 test of the null: no association between EBML and the gene region. Over represented regions are plotted as -log(p) and appear above the x-axis; under represented regions are plotted as log(p) and appear below the x axis. Statistical significance (p = .05) is indicated with a dashed line. The null is rejected for intronic microsatellites (over-represented) and coding microsatellites (under-represented). The same conclusion is reached in both panels suggesting the results are robust to details of the analysis. Note: exonic microsatellites include CDS and UTR microsatellites based on an independent series.

