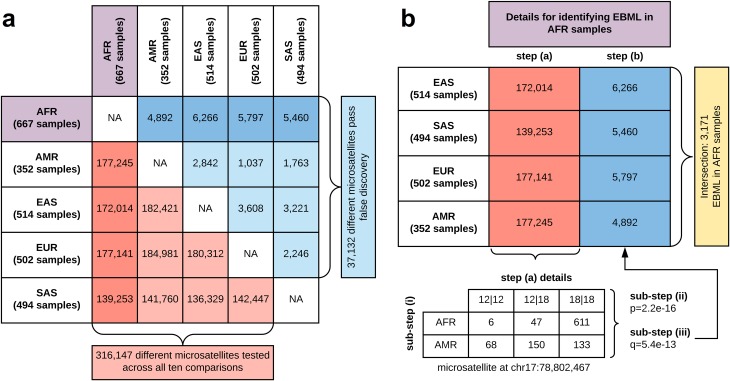
Fig 6. Overall approach and statistical testing of genome wide microsatellites.
a, Number of microsatellites screened (red) and passing false discovery (blue) in pairwise comparisons of 5 super-populations. Details for one super-population (AFR) shown in bold. b, EBML for each super-population are identified using a two-step approach: step (a) pairwise screening against the remaining 4 super-populations, and step (b) convergence of the pairwise screens. Pairwise screens in step (a) involve 3 sub-steps: (i) construct a 2xN contingency table for each microsatellite; (ii) Fisher’s exact test to assign a p-value; (iii) Benjamini-Hochburg multiple testing correction to mitigate false discovery. Only microsatellites rejecting the null–no difference in genotype distribution–are examined in (b). EBML (yellow) are those that reject the null in all 4 pairwise screens: i.e. the set intersection of microsatellites identified in (b). We identify 3,171 EBML for AFR (shown), 450 for EUR, 1,494 for EAS, 647 for SAS, and 335 for AMR.

