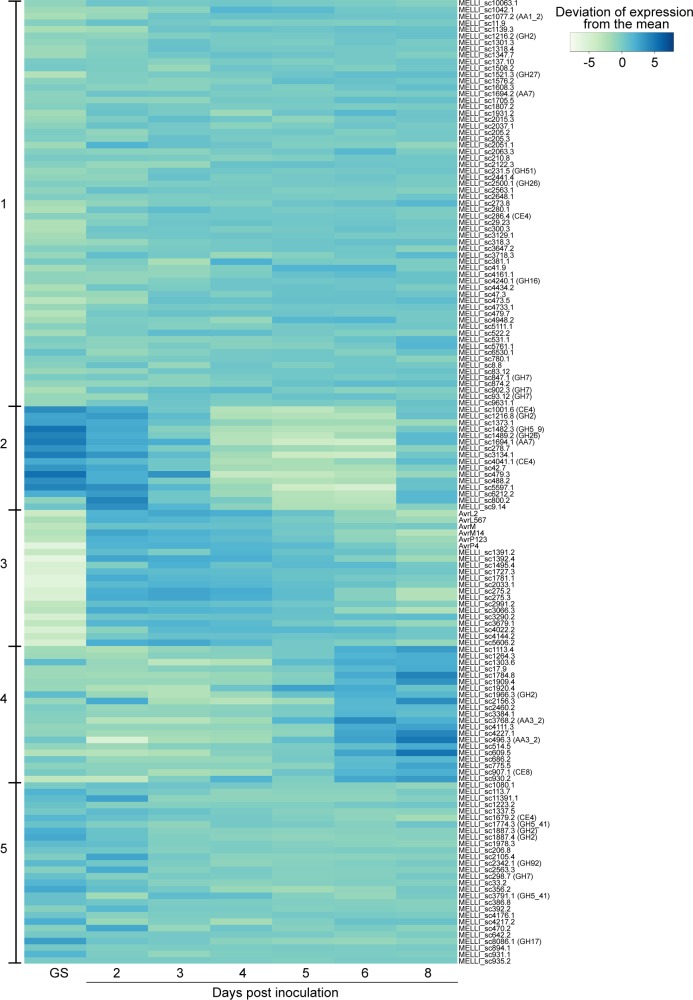
Fig 4. Clustering of Avr genes, candidate effectors and CWDEs based on expression profiles.
Expression values of transcripts were converted into log base 2 of FPKM counts prior to use. Genes with similar patterns of expression are clustered into five groups using the k-means algorithm. The elbow plot method was used to estimate the expected number of clusters in the data [61]. Genes within a cluster are listed in alpha-numerical order by gene designation. The genes included are a subset of those in the full heatmap of the secretome shown in S3 Fig. GS: in vitro germinated spores.

