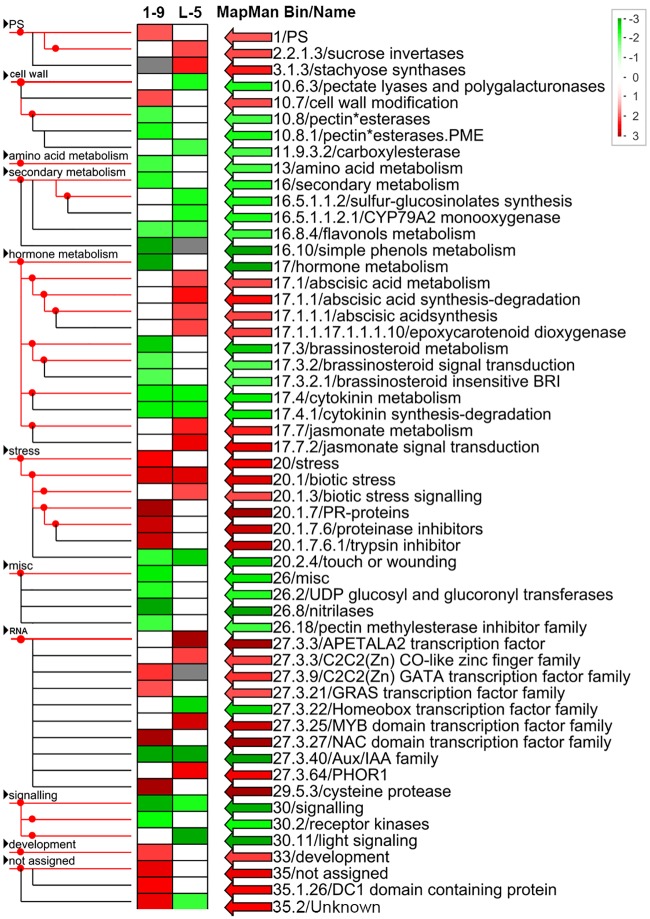
Fig 5. MapMan visualization of differentially represented pathways and functional categories between the 1–9 and L-5 transgenic citrus lines overexpressing CsGH3.1 and CsGH3.1L, respectively.
Each colored rectangular block denotes a MapMan pathway or functional category. Upregulated and downregulated categories are shown in red and green, respectively. The scale bar represents fold change values. The categories differentially represented in the transgenic plants are indicated on the right.

