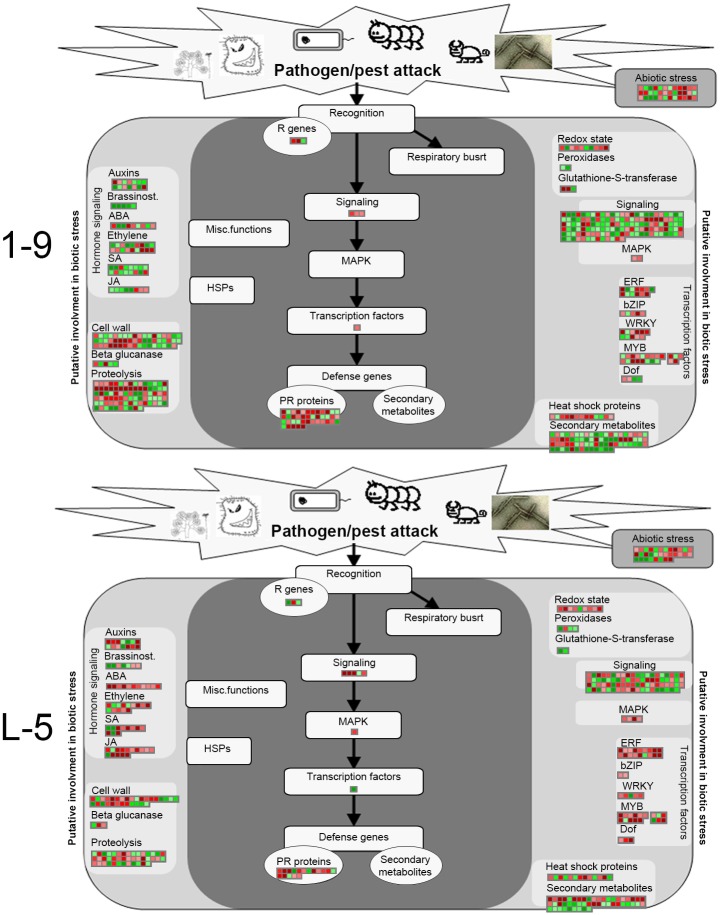
Fig 6. MapMan visualization of the functional categories of genes differentially expressed in response to biotic stress in the 1–9 and L-5 transgenic citrus lines overexpressing CsGH3.1 and CsGH3.1L, respectively.
Significantly upregulated and downregulated genes are displayed in red and green, respectively.

