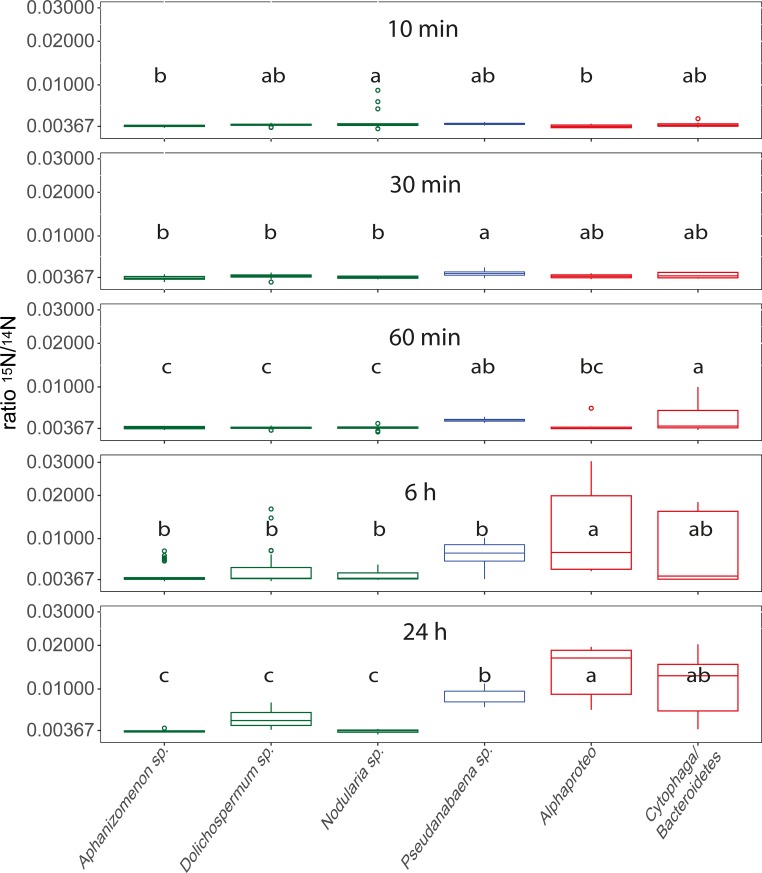
Fig 6. Boxplots of 15N/14N ratios for Aphanizomenon sp., Dolichospermum sp., Nodularia sp., Pseudanabaena sp., Alphaproteobacteria and Cytophaga/Bacteroidetes bacteria over time with square root transformed y-axis.
Values originate from pooled data for the respective species from different spots and cells (S2 Table). Lower case letters above the boxplots refer to different groups of Tukey HSD Post-Hoc tests. Heterocystous cyanobacteria are displayed in green, non-heterocystous cyanobacteria in blue, and associated heterotrophic bacteria in red.

