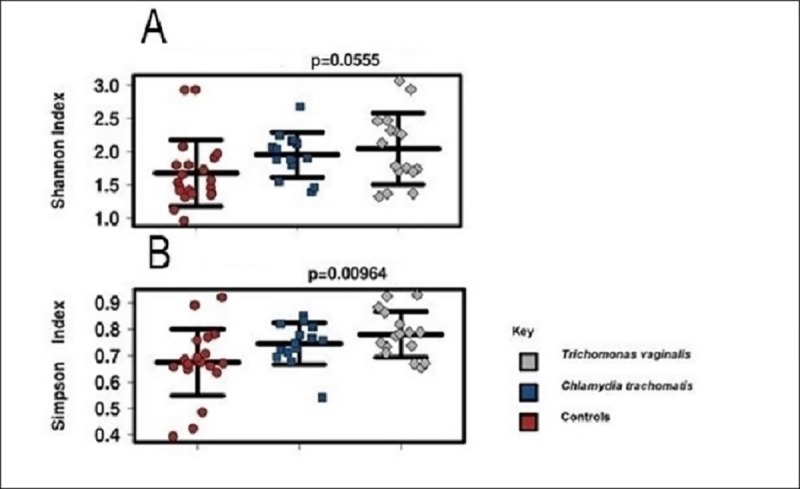
Fig 2. Bacterial α-diversity among the different groups of pregnant women in Kilifi, Kenya.

Dot plots represent (A) Shannon index and (B) Simpson index. Statistical analysis was performed using ANOVA. Lines inside dot plots represent mean ± standard error.
