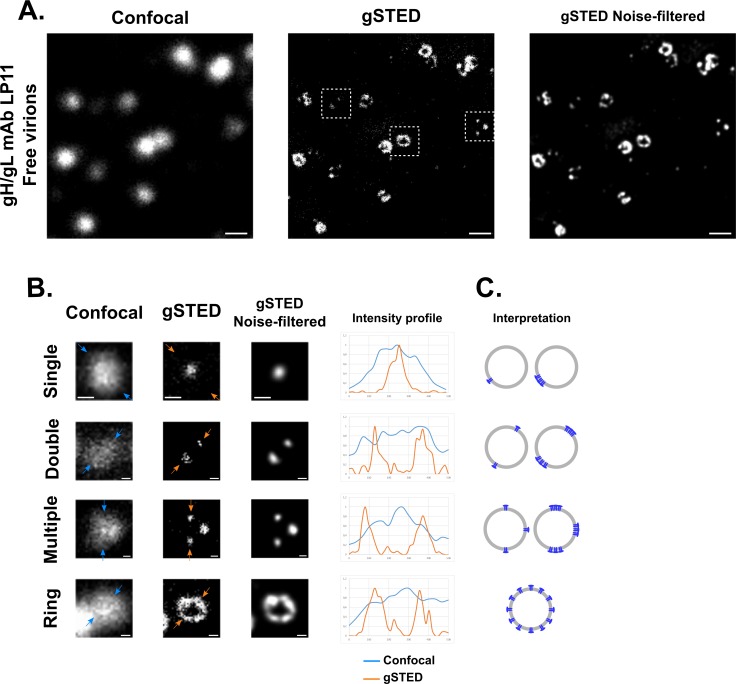
Fig 1. gSTED reveals various features of glycoprotein organization at the surface of viral particles.
(A) Purified WT 17+ virions were attached onto a glass coverslip and labeled with mAb LP11 against gH/gL and an Oregon green 488-labeled secondary antibody. Images were acquired using the diffraction-limited confocal mode or with a gated STED set-up (gSTED). Images were further processed for noise-filtering using Huygens software algorithms. Scale bars: 500 nm. (B) Different patterns of glycoprotein organization were observed in the gSTED mode, which were not resolvable in the confocal mode. From top to bottom these were: single, double, and multiple spots, and rings. Three of the patterns correspond to particles boxed in (A). The single spot image is of a particle labeled with gC-specific mAb IC8 and is included here for illustrative purposes. Each different pattern is shown in the confocal and in the gSTED mode with corresponding noise-filtered images. Arrows delineate the line (500 nm long) used for profile analysis of normalized intensity. The blue line and the orange line in the graph correspond to the intensity profiles observed in the confocal and in the gSTED modes respectively. Analysis was carried out on raw, unprocessed images. Scale bars: 100 nm. (C) Schematic illustration as a 2D projection of the different patterns described in (B). The number of proteins per cluster (one or more) is unknown.

