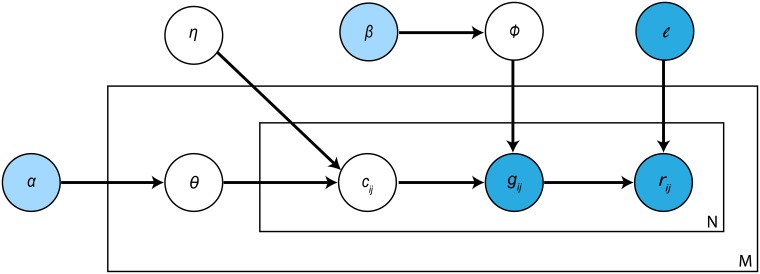
Fig 2. Graphical representation of CDSeq probabilistic model.
The light blue nodes, α, β, denote the hyperparameters that are assumed to be known. The dark blue nodes, ℓ, gij, rij, denote the values of observable random variables (either measured in the study or established in previous studies) whereas the white nodes, η, Φ, θ, cij, are unobservable random variables that need to be inferred from data. The outer box represents samples where M is the sample size, and the inner box denotes the RNA-Seq data of a sample where N is the total number of reads from the sample (see S1 Methods for details).

