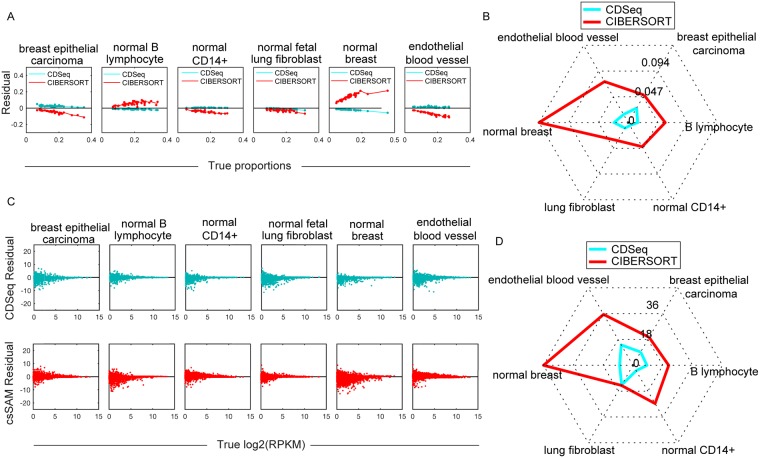
Fig 3. Deconvolution of synthetic mixtures.
We ran CDSeq with six cell types, α = 5, β = 0.5, and 700 MCMC runs. (A) Difference (“residual”) between estimated and true cell-type proportion plotted against true proportion for CDSeq (green) and CIBERSORT (red). Each plotted point represents the value for a single sample. (B) Radar plot of RMSE for estimates of sample-specific cell-type proportions. CDSeq (green); CIBERSORT (red). (C) Difference (“residual”) between estimated and true log2 gene expression level (log2(RPKM)) plotted against true log2 gene expression level for CDseq (green) and csSAM (red). Each plotted point represents a single gene, 22498 genes total. (D) Radar plot of RMSE for gene expression levels (RPKM). CDSeq (green); csSAM (red).

