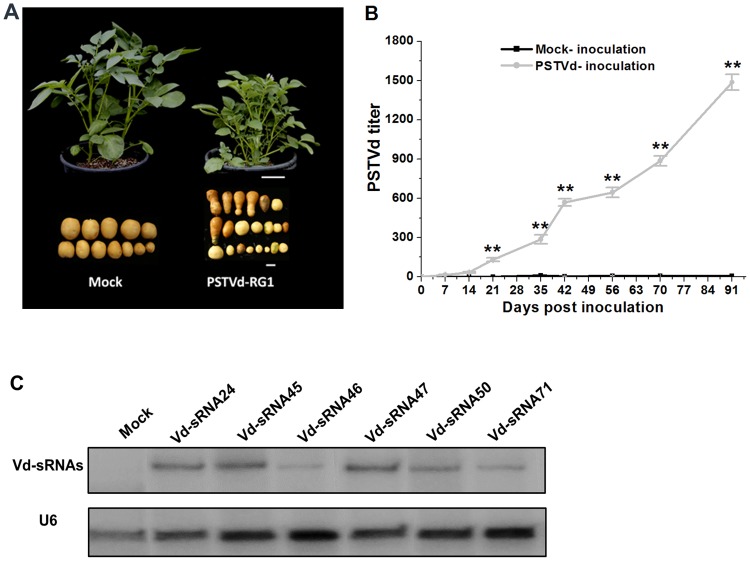
Fig 1. Symptoms associated with PSTVd-RG1 infection in potato.
(A) Abnormal phenotype induced by PSTVd infection of potato cv. Atlantic at 60 dpi. Scale bar = 10 cm in whole plant or = 2 cm in tuber image. (B) Accumulation of PSTVd-RG1 progeny between 7–91 days post inoculation (dpi). Total RNA extracted from mock (black line) or PSTVd RG1-inoculated (grey line) potato plants was used to monitor the PSTVd titer using RT-qPCR. (C) Accumulation of small RNAs derived from the VM region of PSTVd-RG1 at 91 dpi. Small RNA extracted from mock inoculated or PSTVd-infected potato plants were analyzed by northern blot analysis using U6 RNA as an internal control.

