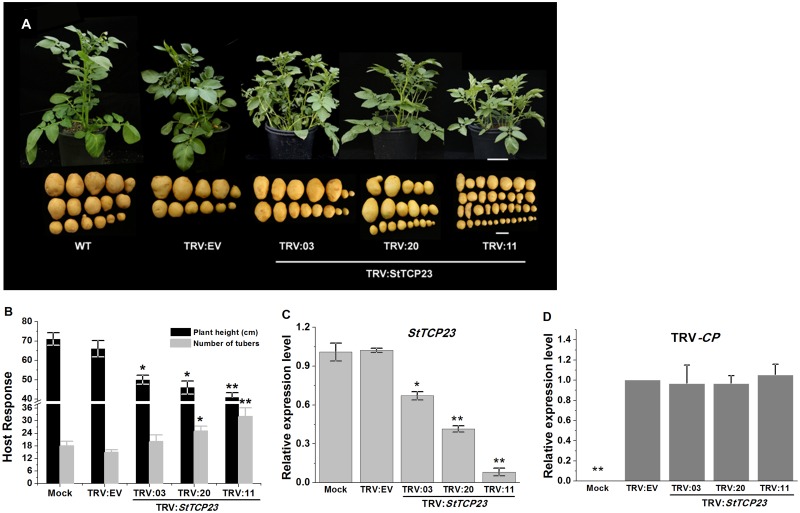
Fig 3. Virus-induced silencing of StTCP23.
(A) Morphology of TRV-infected potato plants in which StTCP23 expression has been suppressed by VIGS. Scale bar = 10 cm (whole plants) or 2 cm (tubers). (B, C) comparison of plant heights and number of tubers (B) and StTCP23 mRNA expression levels (C) in TRV-infected and mock inoculated plants. (D) TRV capsid protein (CP)-coding gene expression levels in StTCP23-silenced and TRV empty vector-treated potato plants as measured by RT-qPCR.

