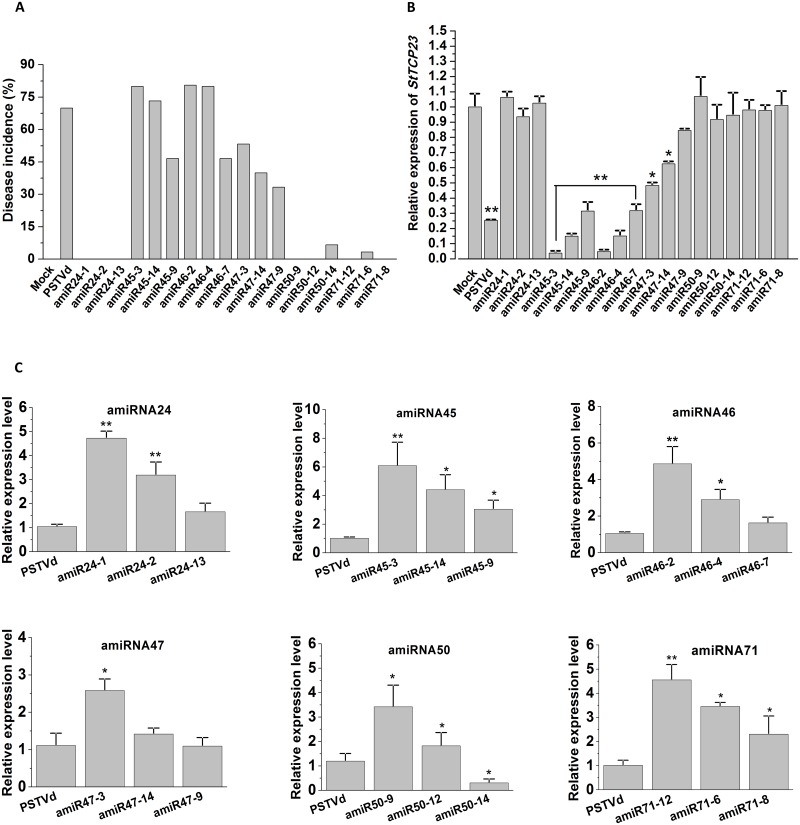
Fig 6. Variation in amiRNA and StTCP23 expression among different transgenic potato lines expressing amiRNAs.
(A) Disease severity index of amiRNA transgenic lines. Mean values (n = 18) are shown. (B) RT-qPCR quantitation of PSTVd sRNA levels in transgenic lines. In each panel, the leftmost bar is a control derived from PSTVd-RG1-infected non-transgenic plants. From left to right, the remaining three bars are values from transgenic plants expressing severe, intermediate, or mild symptoms. (C) Relative StTCP23 mRNA in amiRNA transgenic lines expressing severe, medium, or mild symptoms.

