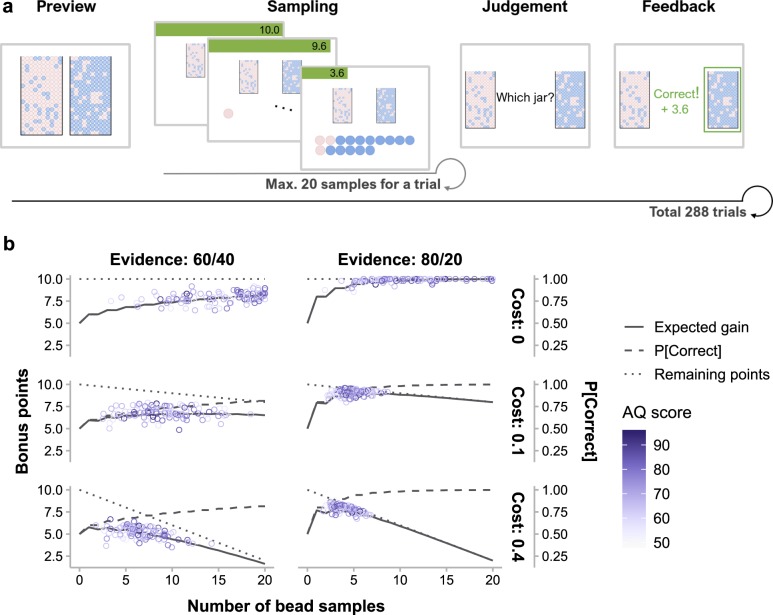
Fig 1. The bead-sampling task.
(a) Time course of one trial. “Preview” informed the participant of the pink-to-blue ratios of the two jars (80%:20% vs. 20%:80% in this example, corresponding to the high-evidence condition). Then the participant could sample beads from the unknown pre-selected jar one at a time up to 20 beads (“sampling”) or quit sampling at any time. Afterward, the participant judged which jar had been selected (“judgment”). Feedback followed, showing the correctness of judgment and winning of the current trial. Feedback was presented for 1 s, whereas preview, sampling, and judgment were self-paced. During sampling, the remaining bonus points (green bar), as well as the array of bead samples, were visualized and updated after each additional sample. (b) Optimal sampling strategy vs. participants’ performance for each of the six cost-by-evidence conditions. On a specific trial, the expected probability of correctness (dashed lines) and the remaining bonus points (dotted lines) are respectively increasing and decreasing functions of the number of bead samples. The expected gain (solid lines), as their multiplication product, first increases and then decreases with the number of samples. Note that the sample size that maximizes expected gain varies across different cost and evidence conditions. Each circle represents a participant with the color indicating their AQ score.

