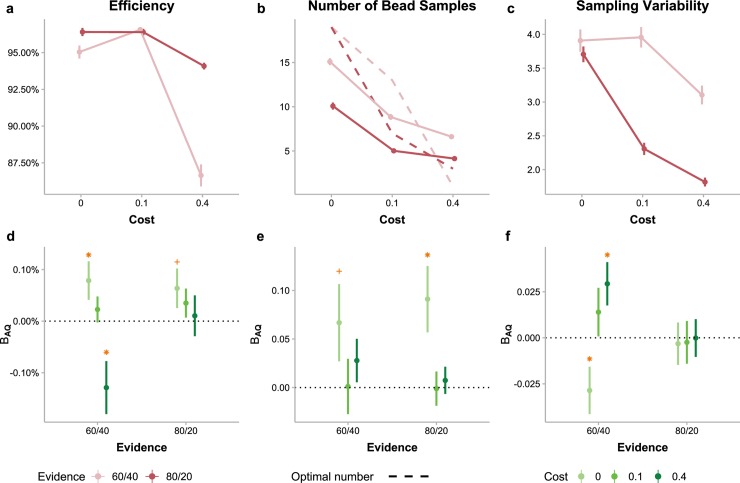
Fig 2. Optimality of sampling performance and the effects of autistic traits.
(a) Sampling efficiency varied with cost (abscissa) and evidence (different colors) conditions. Participants’ efficiency was on average 94% (i.e. close to optimality) but decreased with increasing cost or decreasing evidence, and decreased more dramatically when high cost and low evidence co-occurred. (b) The mean number of bead samples participants drew in a condition (solid lines) decreased with increasing cost or increasing evidence. Compared to the optimal number of samples (dashed lines), participants undersampled in the zero- or low-cost conditions while oversampled in the high-cost conditions. (c) Sampling variability (standard deviation of the numbers of samples drawn across trials) varied with cost and evidence conditions. Error bars in (a)–(c) denote between-subject standard errors. (d)–(f) Effects of AQ levels on participants’ sampling performance in different cost (different colors) and evidence (abscissa) conditions. ΒAQ is the unstandardized coefficient of AQ indicating how much the efficiency (d), number of samples (e), and sampling variability (f) would change when AQ increases by one unit. Error bars represent standard errors of the coefficients. Orange asterisk: p < .05, orange plus: p < .1.

