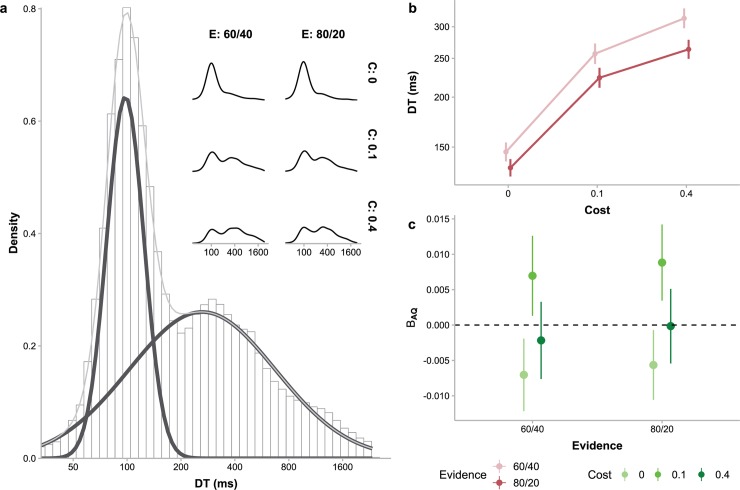
Fig 3. Decision time (DT) for each sampling.
(a) The distributions of DTs aggregated over all participants (main plot) and for each cost and evidence condition (insets). In the main plot, the distribution of DTs (histogram) was clearly bimodal, well fitted by a Gaussian mixture (gray curve) with two Gaussian components (black curves). Such bimodality was also visible in most inset plots, though the relative weights of the two components varied with experiment conditions. (b) Mean DTs varied with cost (abscissa) and evidence (different colors) conditions. Error bars represent between-subject standard errors. (c) Effects of AQ levels on participants’ DTs in different cost (different colors) and evidence (abscissa) conditions. ΒAQ is the unstandardized coefficient of AQ indicating how much the mean DT in a condition would change when AQ increases by one unit. Error bars represent standard errors of the coefficients.

