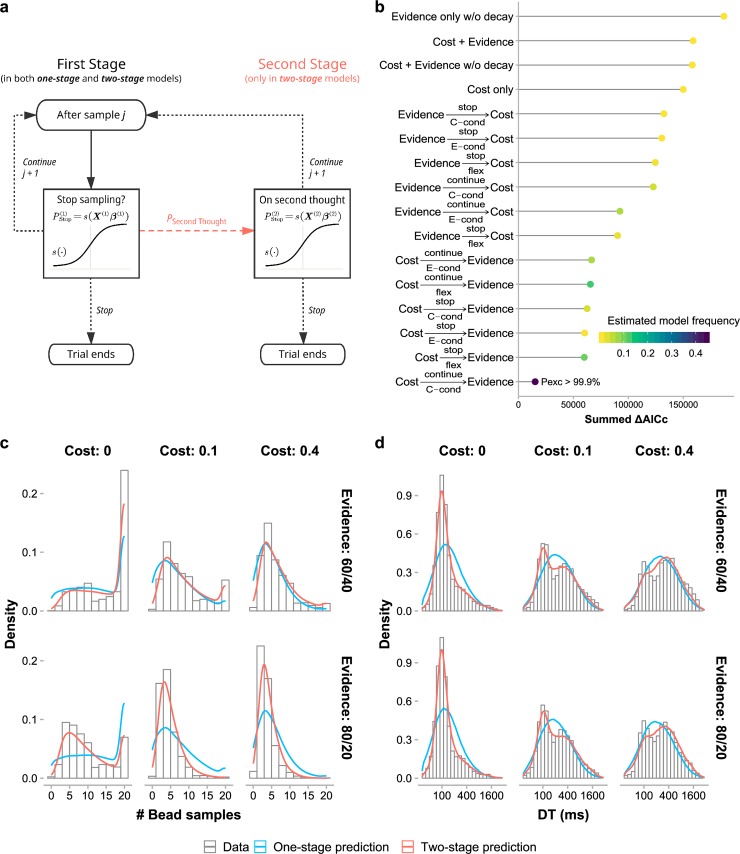
Fig 4. Computational modeling of sampling choices and decision times.
(a) Schematic of one-stage and two-stage models. One-stage models only consist of the steps on the left-hand side: Each time a participant decides whether to stop or continue sampling, the probability of stopping is a sigmoid function of a linear combination of multiple decision variables. Two-stage models assume that participants may probabilistically have a second thought to reconsider the choice (the coral dashed arrow). The second stage (on the right-hand side) works in the same way as the first stage but the two stages are controlled by different sets of decision variables. (b) Results of model comparison based on the joint fitting of choice and DT. The ΔAICc for a specific model was calculated for each participant with respect to the participant’s best-fitting model (i.e. lowest-AICc) and then summed across participants. Both fixed-effects (summed ΔAICc: lower is better) and random-effects (estimated model frequency: higher is better) comparisons revealed that the best-fitting model was a two-stage model with cost-related variables considered in the first stage and evidence-related variables in the second stage (i.e. ). The best one-stage model was the model involving only cost-related decision variables (i.e. Cost only). See Methods (or S1 Table) for the description of each model. Estimated model frequency (color coded) is a random effects measure of the proportion of participants best fit by the model. (c) Distribution of sample sizes (i.e. number of bead samples) for each condition: data vs. model predictions. (d) Distribution of DTs for each condition: data vs. model predictions. The best-fitted two-stage model (red curves) well predicted the observed distributions (histograms) of sample sizes and DTs for each cost and evidence condition, including the bimodality of the observed DT distributions, while the best-fitted one-stage model (blue curves) failed to do so. Both data and model predictions were aggregated across participants.

