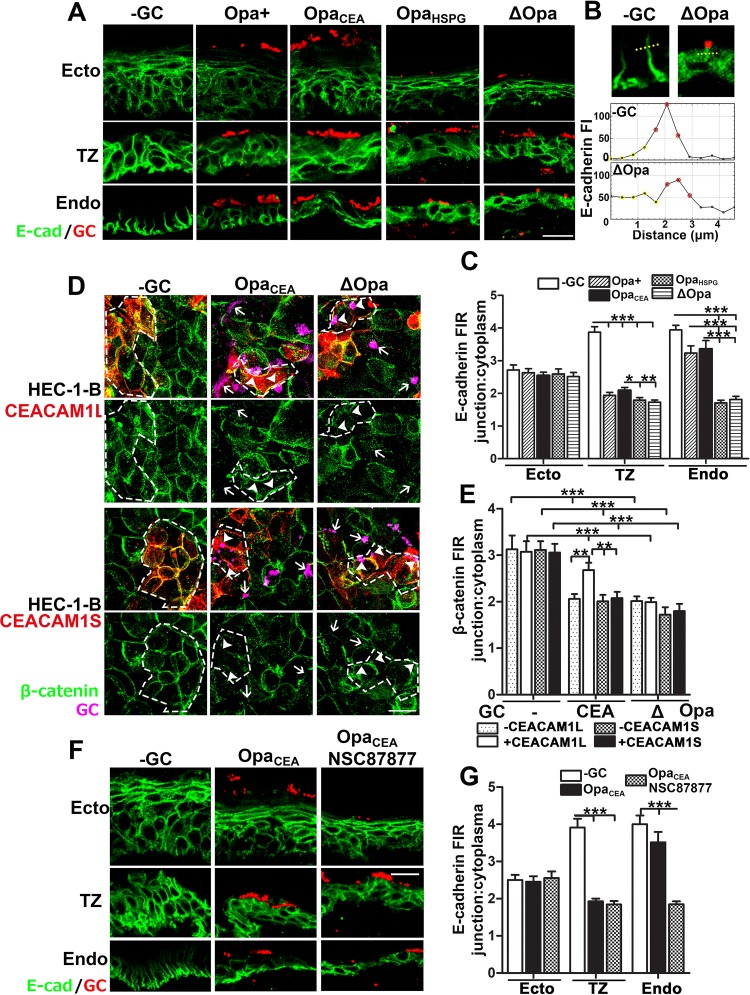
Fig 6. GC induce the disassembly of E-cadherin-based cell-cell junctions exclusively in the TZ and the endocervix.
(A-C) Tissue explants were inoculated with Pil+ OpaCEA, OpaHSPG or ΔOpa GC for 24 h (MOI~10), washed at 6 and 12 h post-inoculation, and cryopreserved. Tissue sections were collected, processed, stained for GC and E-cadherin (E-cad), and analyzed using CFM. Shown are representative CFM images (A). Disruption of cell-cell junctions was determined by the FI ratio (FIR) (±SEM) of E-cad (C) at the cell-cell border (red dots in B) relative to the cytoplasm (yellow dots in B) using FI line profiles crossing cell-cell junction (B). (D-E) HEC-1-B cells transfected with or without CEACAM1L or 1S, inoculated with Pil+OpaCEA or Pil+ΔOpa GC for 6 h, and stained for GC, CEACAMs, and β-catenin. Shown are representative CFM images (D). Dashed lines, cells expressing CEACAM1L or 1S. Disruption of cell-cell junctions was determined by the FIR (±SEM) of β-catenin at the cell-cell border to the cytoplasm (E). (F-G) Human cervical tissue explants were inoculated with Pil+OpaCEA GC with or without the SHP inhibitor (20 μM) for 24 h. Tissue sections were stained for E-cad and GC. Shown are representative CFM images (F). Disruption of cell-cell junctions was determined by the FIR (±SEM) of E-cad at the cell-cell border to the cytoplasm (G). Shown were the average of 50~200 individual cells in 20 randomly acquired images from each cervical region of 3 human cervixes (C and G) or 3 independent experiments (E). Scale bar, 20 μm. **p< 0.01; ***p<0.001, as determined by Student’s t-test and one-way non-parametric ANOVA (Kruskal-Wallis test).

