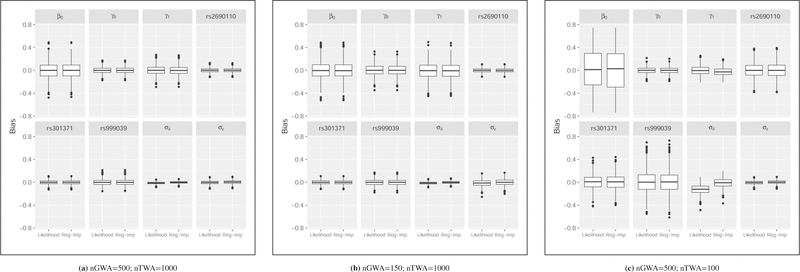
FIGURE 1. Simulation-based parameter distributions after convergence for normalized expression data.

The distribution of parameter estimates minus their true values across 1000 simulations are illustrated. *A subset of the 20 SNPs analyzed are illustrated in this figure to reflect a range of effect sizes and minor allele frequencies: : rs2690110 has a minor allele frequency of 0.36 and an estimated parameter value (based on the observed data) of 0.25; rs301371 has a minor allele frequency of 0.42 and an estimated parameter value of 0.049; and rs999039 has a minor allele frequency of 0.17 and an estimated parameter value of 0.053. While decreasing the sample size of the GWA data set (left-hand and center panels) increases the variability in the parameter estimates, the impact of reducing the TWA sample size is more impactful (right-hand panel) with greater bias and variability for both the fully likelihood-based and single regression imputation approaches. Numerical summaries are provided in Table 1
